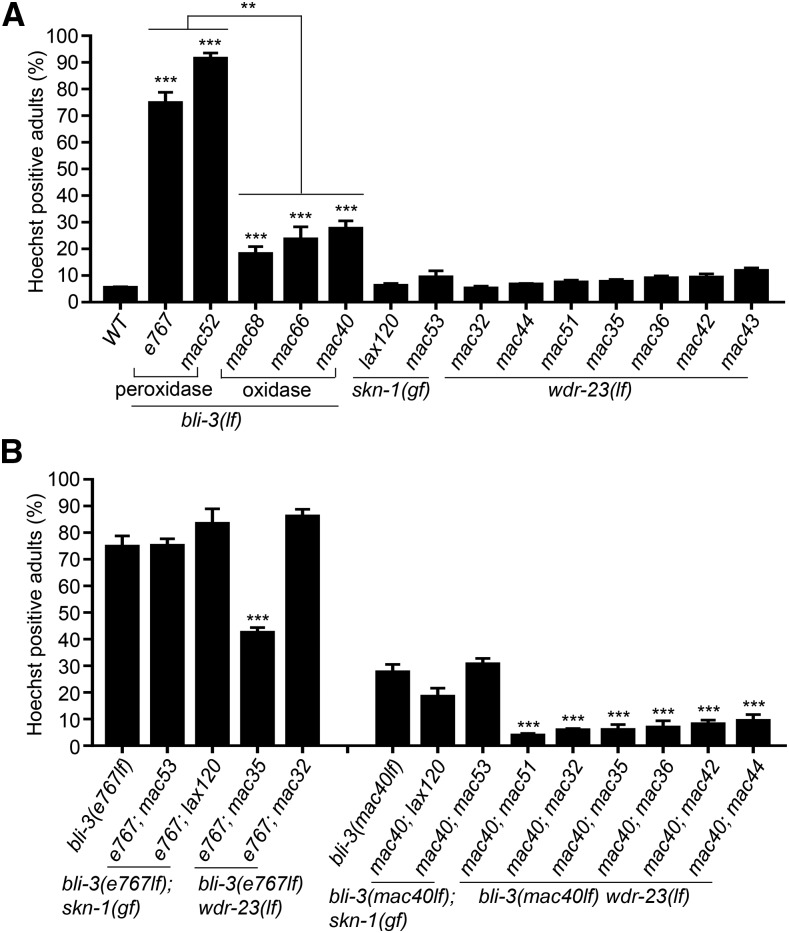
Figure 3.
Cuticle integrity of single and double mutants based on Hoechst 33258 staining. (A) Percentage of Hoechst-positive single mutants. (B) Percentage of Hoechst-positive double mutants compared to single mutants. Results are from four biological replicates (n = 100 for each). Comparisons were made with WT or between genotypes. Error bar: Mean ± SE. Statistics: Bonferroni test with one-way ANOVA. *: P < 0.05; **: P < 0.01; ***: P < 0.001.

