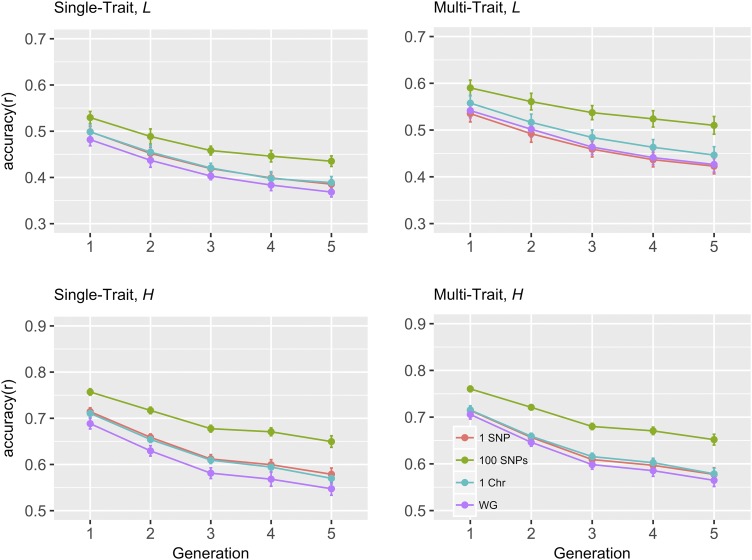
Figure 1.
Change in prediction accuracy for weighted GBLUP over generations with varying regions sizes of genome regions, for 200 QTL scenario. L and H: low (0.1) and high (0.4) heritability traits, respectively; different colors represent different region sizes; Chr: chromosome; WG: whole genome (or equivalently, GBLUP).

