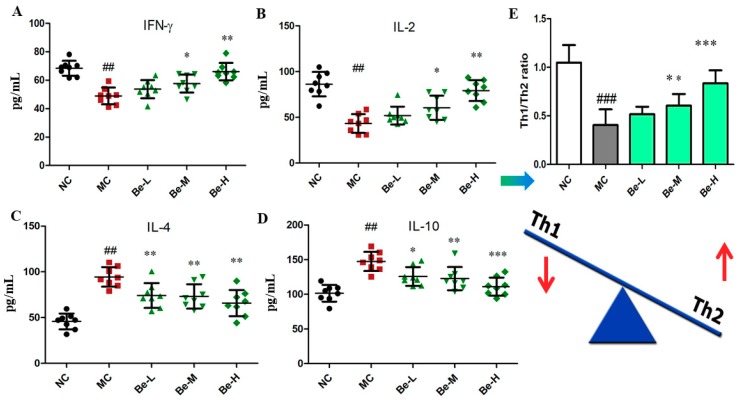
Figure 2.
Effect of bergenin on cytokines in the Cy-treated mice serum. (A) Serum IFN-γ levels; (B) Serum IL-2 levels; (C) Serum IL-4 levels; (D) Serum IL-10 levels; (E) Th1 and Th2 cytokine ratio. NC: normal control group, dosed with saline; MC: model control group, challenged with cyclophosphamide; Be-L: challenged with Cy and treated with 5 mg/kg/day bergenin; Be-M: challenged with Cy and treated with 10 mg/kg/day bergenin; Be-H: challenged with Cy and treated with 20 mg/kg/day bergenin. Data are expressed as mean ± SD (n = 8). ## p < 0.01 and ### p < 0.001 vs. the NC group, * p < 0.05, ** p < 0.01 and *** p < 0.001 vs. the MC group.

