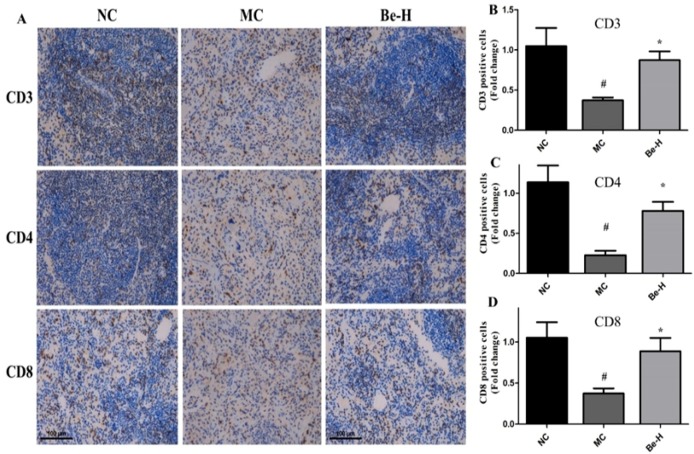
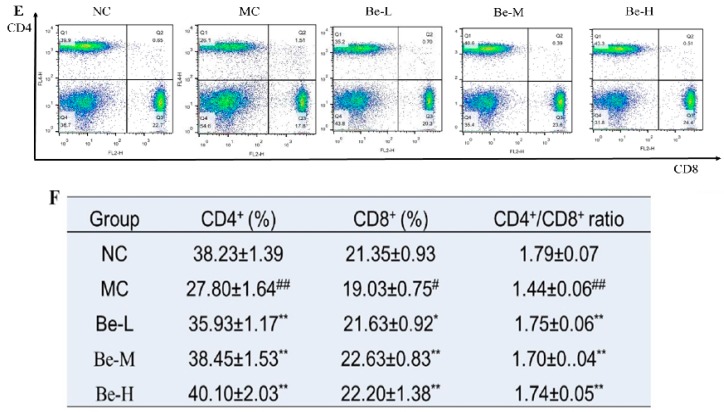
Figure 4.
Effects of bergenin on splenic T lymphocyte subsets in the Cy-treated mice. (A) CD3+, CD4+ and CD8+ T lymphocyte expression in spleen tissues. (B) Bar graphs represent mean ± SEM of the numbers of CD3+-positive cells from five microscopic fields in each group. (C) Bar graphs represent mean ± SD of the numbers of CD4+-positive cells from five microscopic fields in each group. (D) Bar graphs represent mean ± SEM of the numbers of CD8+-positive cells from five microscopic fields in each group. (E) Splenic T lymphocyte subsets detected by flow cytometry. (F) Splenic T lymphocyte subpopulation analyzed by flow cytometry. NC: normal control group, dosed with saline; MC: model control group, challenged with cyclophosphamide; Be-L: challenged with Cy and treated with 5 mg/kg/day bergenin; Be-M: challenged with Cy and treated with 10 mg/kg/day bergenin; Be-H: challenged with Cy and treated with 20 mg/kg/day bergenin. Values are shown as mean ± SD (n = 8). # p < 0.05, ## p < 0.01 vs. the NC group, * p < 0.05 and ** p < 0.01 vs. the MC group.


