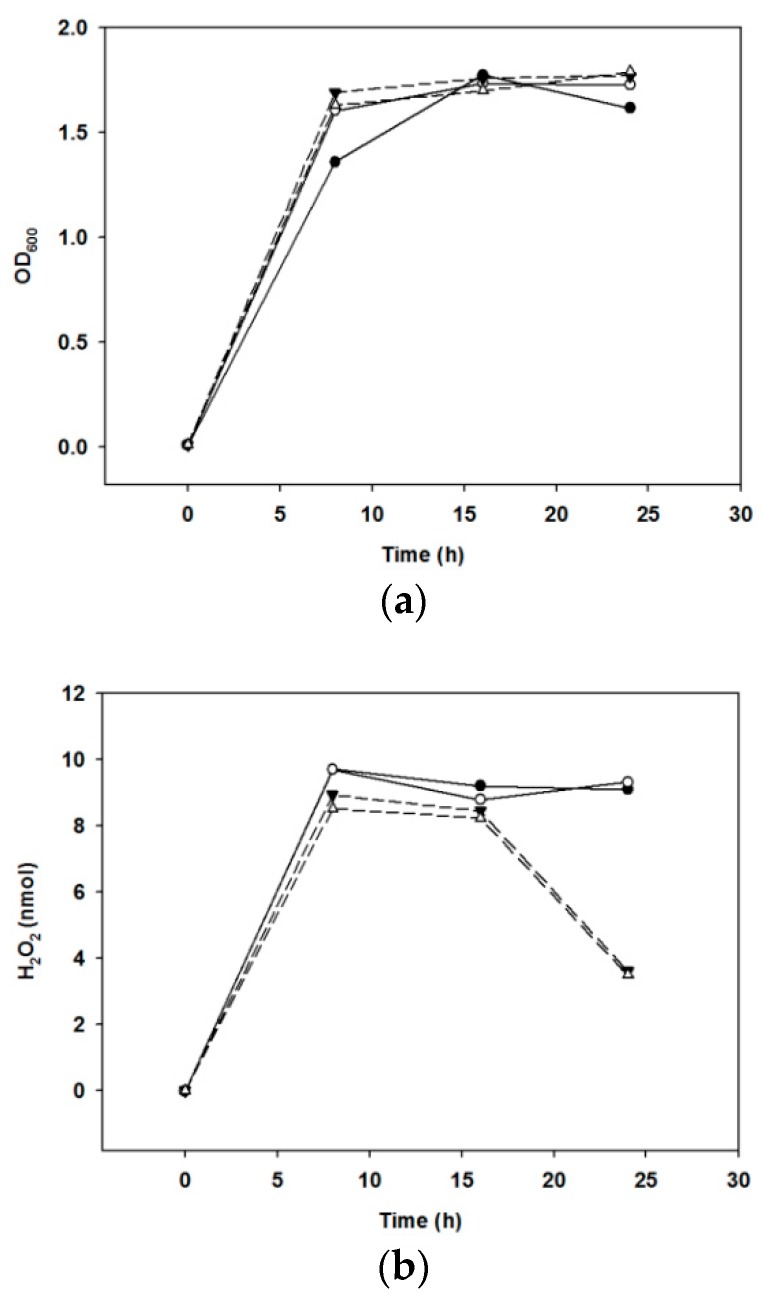
Figure 3.
Growth and H2O2 production under various conditions. (a) Growth was monitored spectrophotometrically at 600 nm. (b) Production of H2O2, determined as mentioned in Section 4. Solid lines, aerobic incubation at 30 °C (●) and at 37 °C (○); broken lines, anaerobic incubation at 30 °C (▼) and at 37 °C (△).

