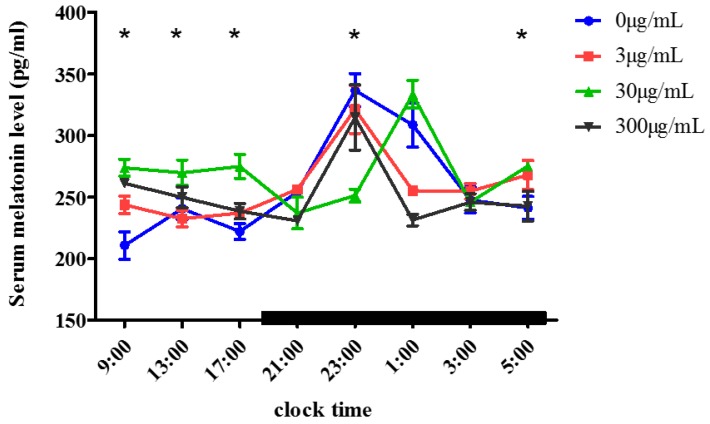
Figure 1.
Serum melatonin levels in mice after oral melatonin. The mice were treated with different concentrations of melatonin (0 μg/mL, 3 μg/mL, 30 μg/mL, 300 μg/mL) in their drinking water for 3 weeks, then the serum melatonin was measured by ELISA at different time points (mean ± SD, n = 3). Bars indicate scotophase duration. “*” indicates that there was a significant difference (p < 0.05) between the 30 μg/mL melatonin-treated group and the control group at different time points.

