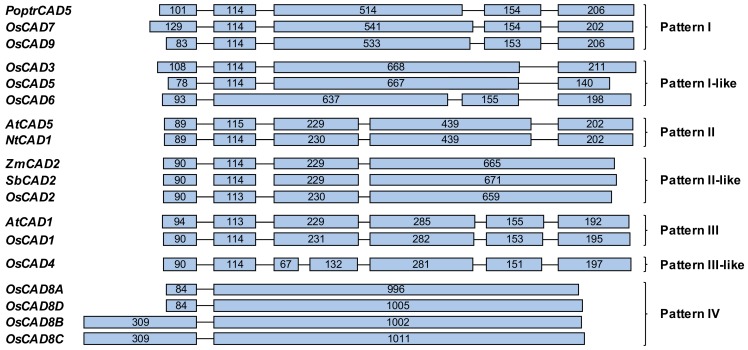
Figure 1.
The exon-intron structures of the OsCADs and other plant CAD genes. Exons and introns are indicated by boxes and lines, respectively. The numbers in the boxes indicate the exon sizes, and the intron sizes are not to scale. The exon-intron patterns of the plant CADs are indicated on the right side. A. thaliana CAD (AtCAD), Z. mays CAD (ZmCAD), P. trichocarpa CAD (PoptrCAD), S. bicolor CAD (SbCAD) and N. tabacum CAD (NtCAD).

