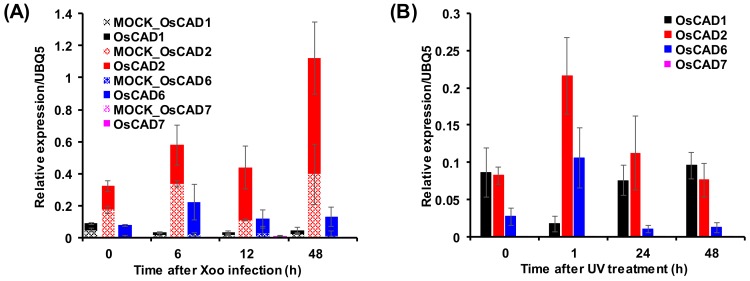
Figure 6.
Expression of OsCAD1, 2, 6, and 7 in response to Xoo infection (A) and UV-irradiation (B). The expression levels of the OsCADs were examined by qRT-PCR analysis using specific primers (Supplementary Table S2). A ubiquitin gene (OsUBQ5) was amplified and used as an internal control. The expression levels of each OsCAD gene are presented as the relative expression compared to the OsUBQ5 transcript levels. qRT-PCR analysis was performed on triplicate biological samples.

