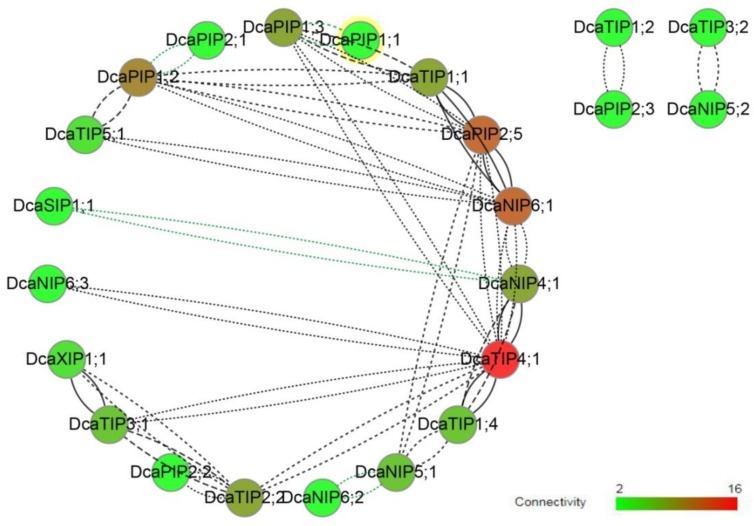
Figure 3.
Co-expression network of DcaAQP genes constructed based on the RNA-seq results in this study. The network was obtained with CoExpNetViz (Tzfadia et al. 2016) and visualized by Cytoscape V. 3.1.0 (Shannon et al. 2003). Black and green lines denote positive correlation and negative correlation, respectively. Correlation from weak to strong represents dotted line to solid line. Connectivity from weak to strong represents from green to red.

