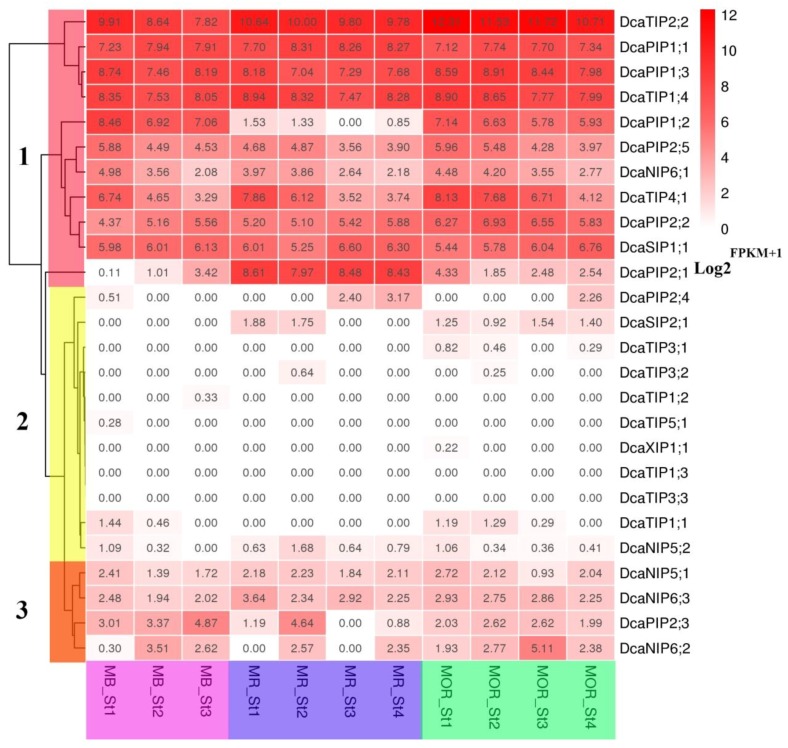
Figure 5.
Expression profiles of DcaAQP genes during flower opening stages. MB, MR and MOR represent three carnation cultivars. St1 means stage1, St2 means stage2, St3 means stage3, St4 means stage4. A heat-map shows the hierarchical clustering of relative expression of all DcaAQP genes during flower opening stages analyzed. The vertical color scale at right of the image represents log2FPKM+1: the expression level were displayed by the depth of red.

