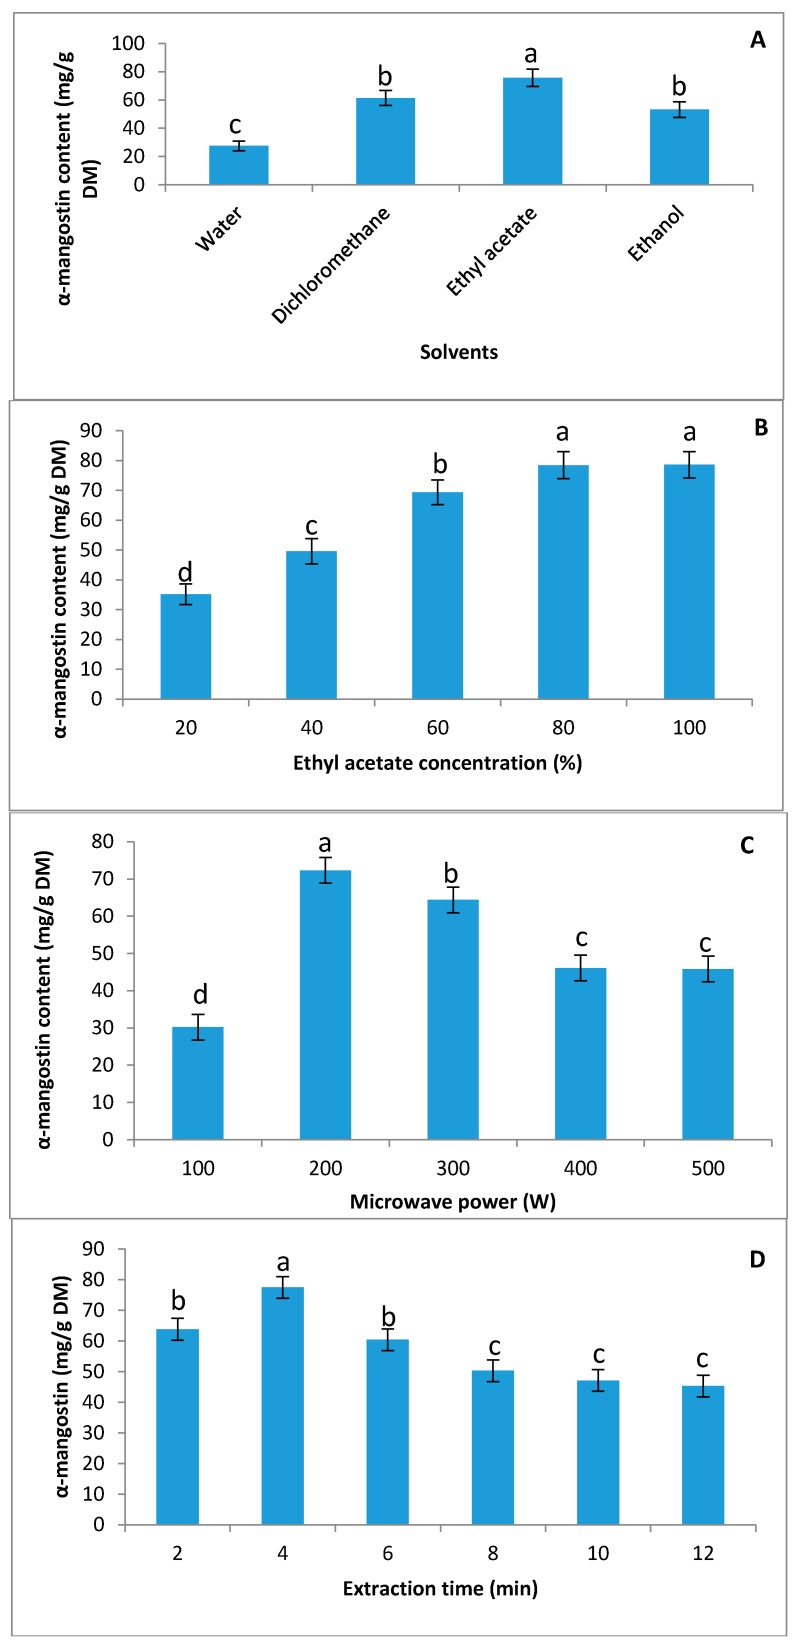
Figure 1.
The effect of various solvents, the concentration of solvent, and microwave power on α-mangostin content in the extraction process. (A) Effect of various solvents on the extraction yield of α-mangostin; (B) effect of ethyl acetate concentration on the extraction yield of α-mangostin; (C) effect of microwave power on the extraction yield of α-mangostin; (D) effect of various extraction times on the extraction yield of α-mangostin. Different superscript lower-case letters (a,b,c,d) indicate significant differences at p < 0.05 (Duncan’s test).

