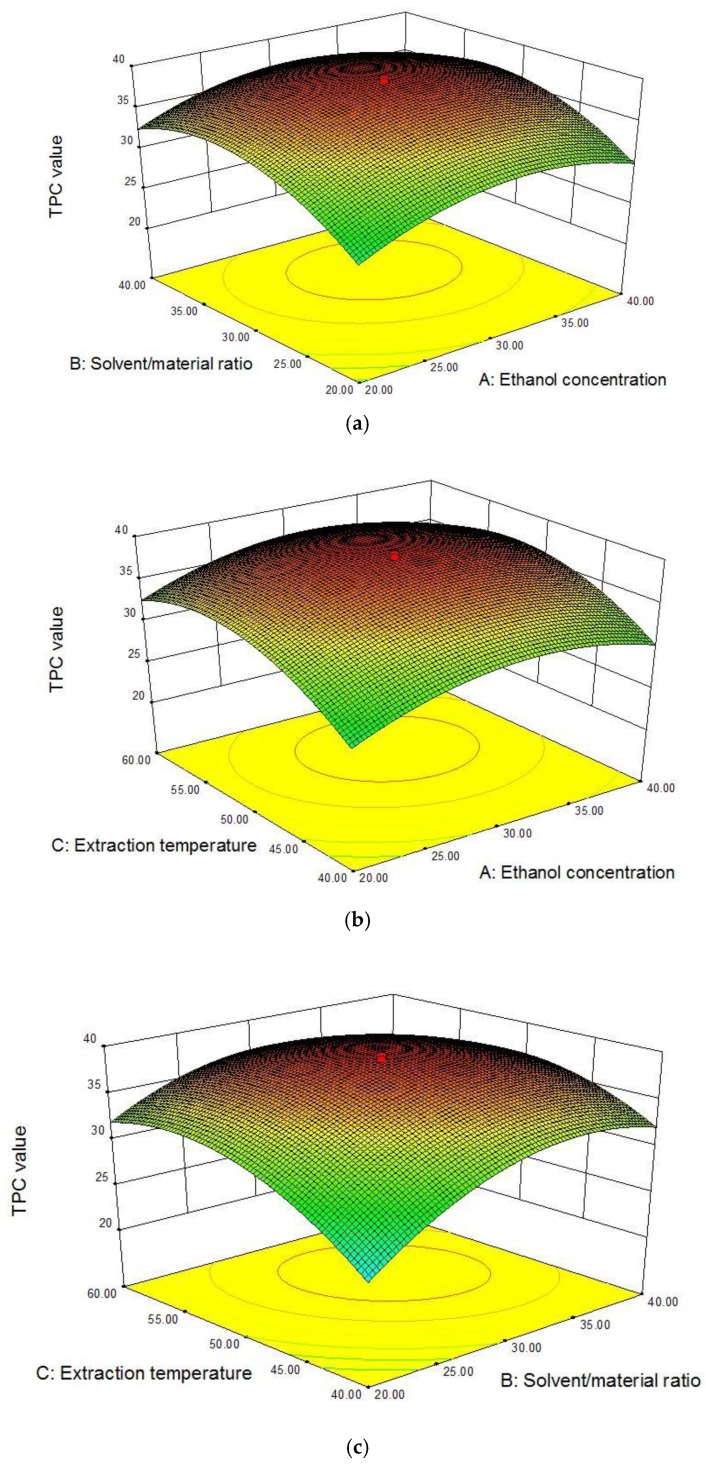
Figure 2.
Graphical analysis of the effects of ethanol concentration (X1, %) and solvent/material ratio (X2, mL/g) (a); ethanol concentration (X1, %) and extraction temperature (X3, °C) (b); and solvent/material ratio (X2, mL/g) and extraction temperature (X3, °C) (c) on total phenolic content value (mg GAE/g DW).

