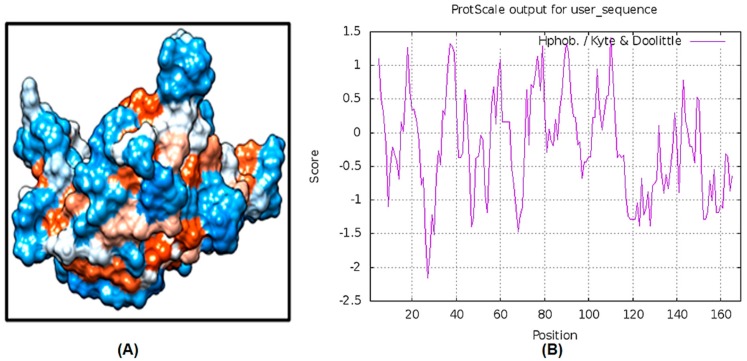
Figure 2.
Analysis of LuxS protein hydrophobicity. (A) the hydrophilic areas of the LuxS protein are shown in blue, and hydrophobic regions are shown in red, while white represents areas with hydrophobicity values of 0.0. (B) Kyte and Doolittle hydropathy plot showing that the LuxS protein is moderately hydrophilic.

