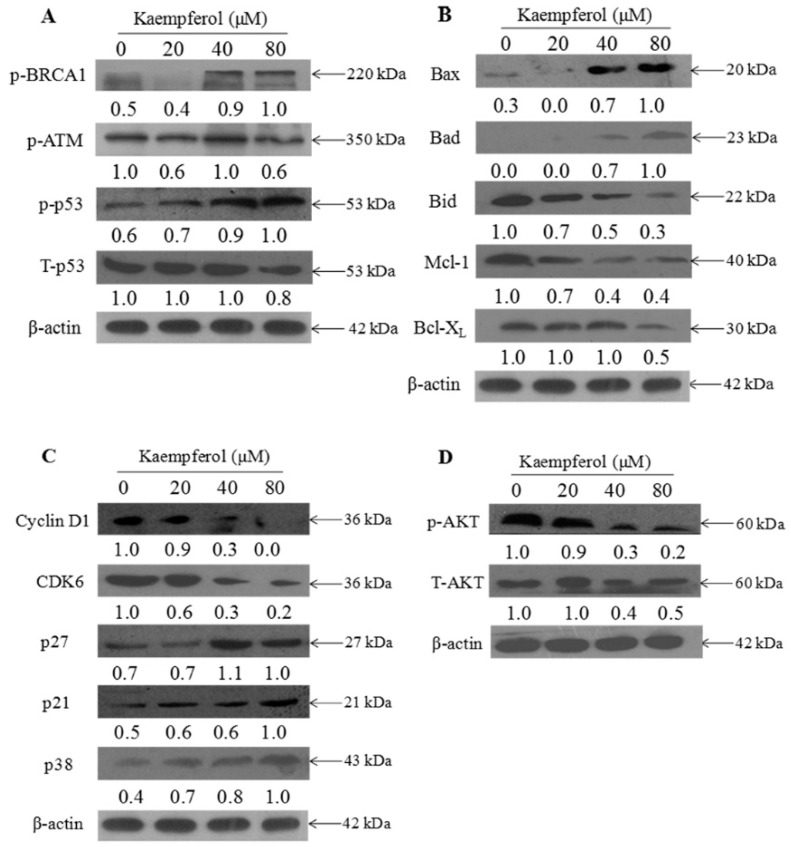
Figure 5.
The expression levels of signal protein in EJ cells treated with kaempferol by western blotting. (A) p-BRCA1, p-ATM, p-p53, and T-p53. (B) Bax, Bad, Bid, Mcl-1, and Bcl-xL. (C) Cyclin D1, CDK6, p27, p21, and p38. (D) Phosphorylated AKT (p-AKT) and total AKT (t-AKT). β-actin was used as the loading control. The protein expression levels are percentages of the control. Relative intensity was shown above each immunoblotted protein and condition. Representative images of three independent experiments are presented.

