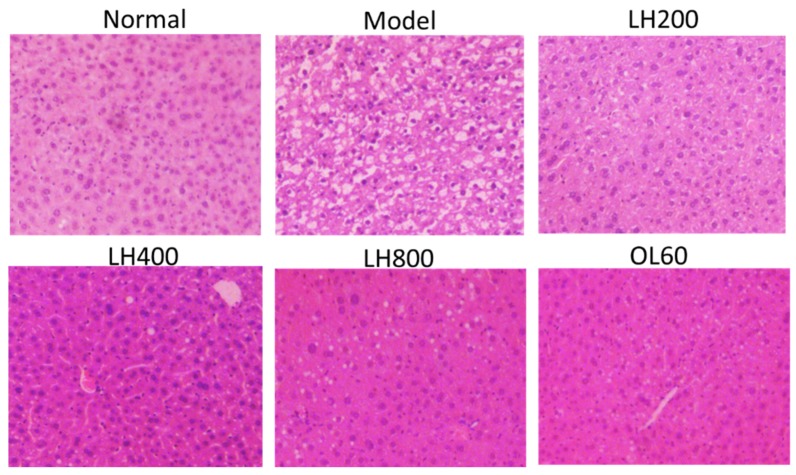
Figure 5.
Effects of LH on the liver pathology of mice. H&E staining (100× magnification). Normal, normal group; model, high-fat control group. LH200, LH400, and LH800: groups orally treated with LH at dosages of 200, 400, and 800 mg/kg/day, respectively; OL60: group orally treated with OL at 60 mg/kg/day (n = 10).

