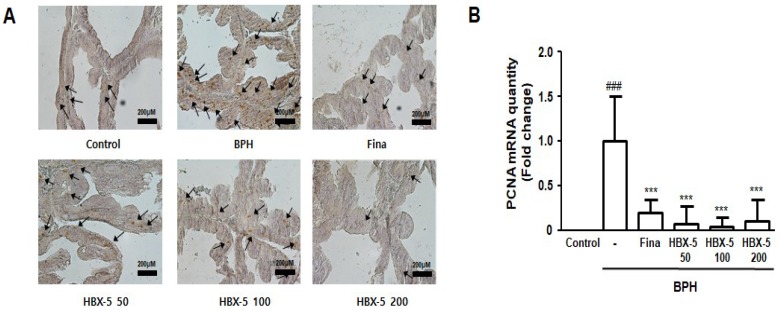
Figure 6.
Effect of HBX-5 administration on the expression of PCNA. (A) The manifestation of PCNA in prostate tissues was performed by IHC staining. The arrows indicate immunoreactivity of PCNA in the representative pictures of each group. (B) Expression of mRNA for PCNA in prostate tissues was analyzed by quantitative real-time PCR. The data presented as the mean ± standard error of the mean of 10 rats per group (### p < 0.001 vs. Con group; *** p < 0.001 vs. BPH group). Control, Control group; BPH, rats with BPH group; Fina, rats with BPH group treated with 5 mg/kg/day of finasteride; HBX-5 50, rats with BPH group treated with 50 mg/kg/day of HBX-5; HBX-5 100, rats with BPH group treated with 100 mg/kg/day of HBX-5; HBX-5 200, rats with BPH group treated with 200 mg/kg/day of HBX-5.

