Figure 2.
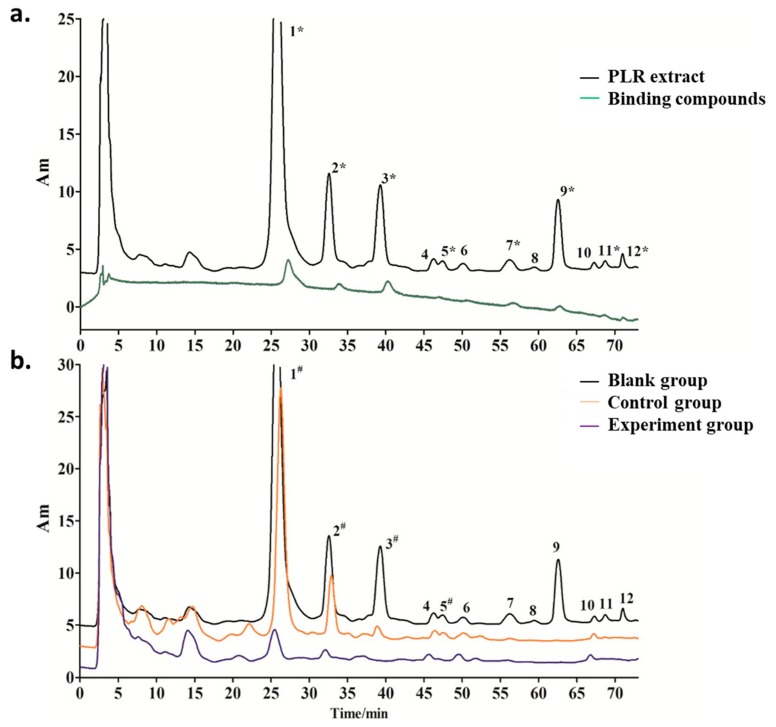
HPLC analysis: (a) HPLC chromatogram of Puerariae lobatae Radix extract (black) and the filtrates from test groups (green): the decrease peaks of test groups comparing with PLR extract indicate the binding compounds; (b) HPLC chromatogram of the filtrates respectively collected from blank groups (black), control groups (orange) and experiment groups (purple).

