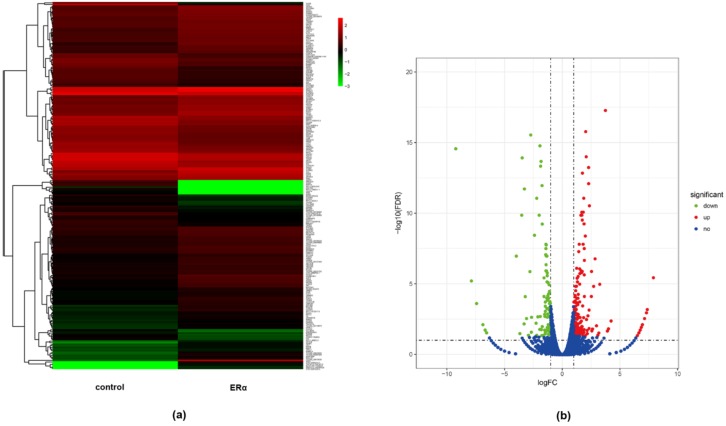
Figure 1.
Identification of differentially expressed genes (DEGs) between ERα transgenic MDA-MB-231 and wild type MDA-MB-231 cells. (a) Hierarchical cluster of differential expression levels between ERα transgenic MDA-MB-231 cells and wild type MDA-MB-231 cells. The color scale represents log10 expression values, red indicates the high expression level, and the green refers to the low expression level. (b) The scatter plot of DEGs. Each point represents a gene. Red points represent up-regulated genes. Green points represent down-regulated genes. Blue points refer to genes without differential expression.

