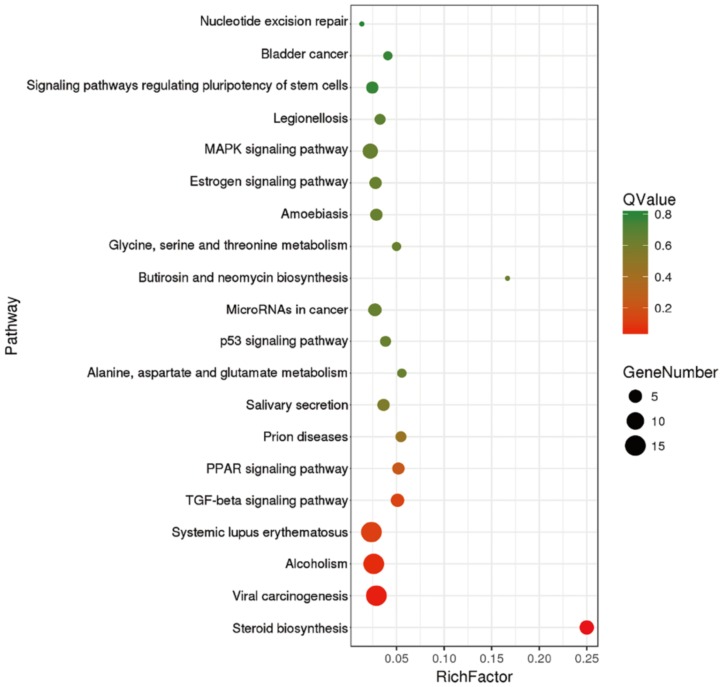
Figure 4.
TOP20 significantly enriched KEGG pathways of ERα regulated DEGs. Each point represents a specific KEGG signaling pathway, and the size of the point indicates the number of DEGs enriched in each pathway. Rich Factor refers to the enrichment level of DEGs enriched to the pathway. Q value, the closer to zero indicating the enrichment is more significant.

