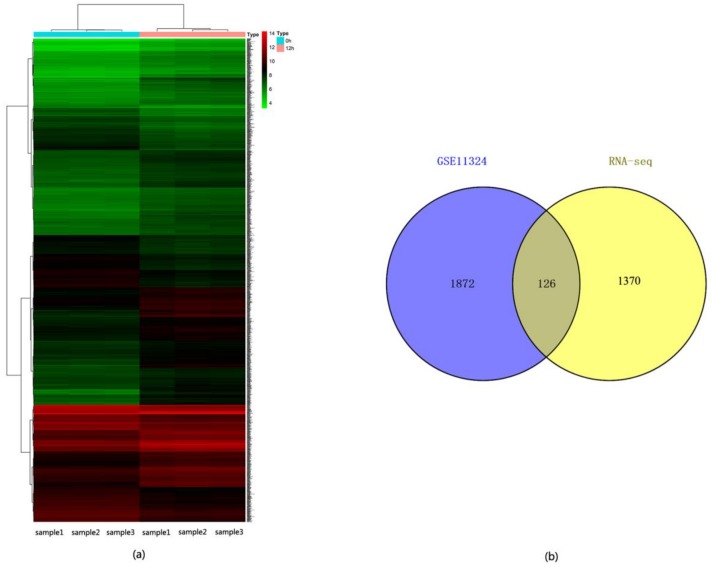
Figure 7.
Analysis of differentially expressed genes (DEGs) for dataset GSE11324. (a) Heatmap showing the hierarchical cluster of differential expression levels between 12 h group of E2 stimulated MCF-7 cells and 0 h group. Gene expressed in different level is indicated in different colors. Red indicates the high expression level, and the green refers to the low expression level. (b) The overlapped DEGs between ERα transgenic MDA-MB-231 cells and E2 stimulated MCF-7 cells.

