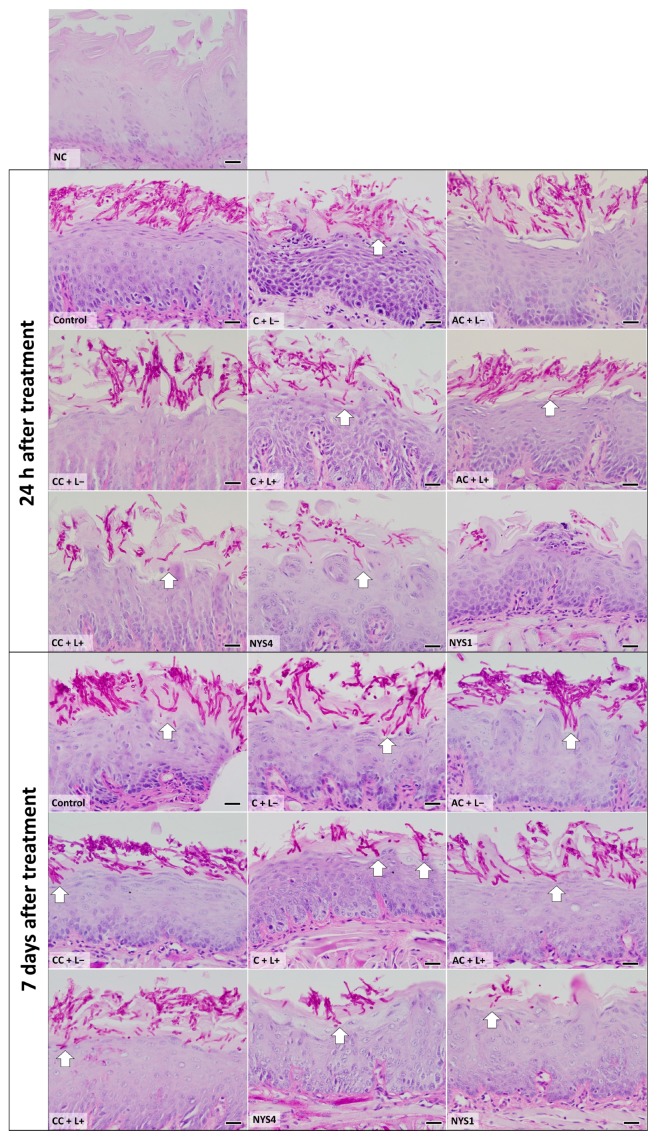
Figure 6.
Light micrographs showing sections of tongue mucosa submitted to the periodic acid-Schiff (PAS) histochemical method. The light micrographs show the epithelium tongue of healthy, infected, and treated animals, euthanized 24 h and seven days after treatment. NC group: healthy and untreated animals; Control group: infected animals that did not receive any treatment (C − L−); C + L+, AC + L+, and CC + L+ groups corresponded to the animals treated with aPDT mediated by free CUR, anionic and cationic CUR-NP, respectively, and blue LED light; C + L−, AC + L−, and CC + L− groups corresponded to evaluation of each PS alone (free CUR, and anionic and cationic CUR-NP, respectively); NYS1 and NYS4 groups: animals treated with Nystatin 100,000 IU once (under anesthesia) and four times daily, respectively. Arrows: invasion of C. albicans in the subjacent epithelium. Magnification: ×40. Scale bar: 20 μm.

