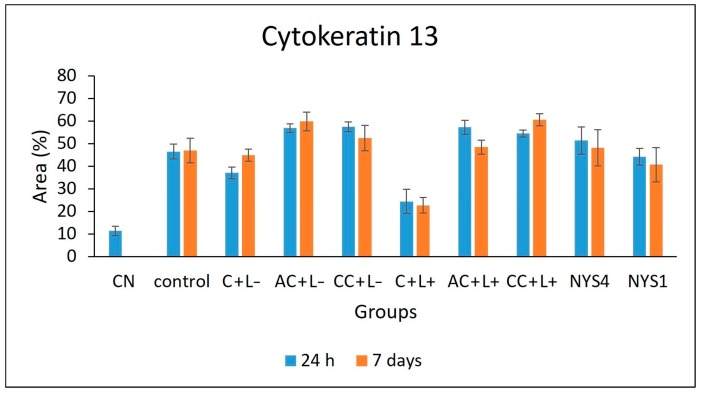
Figure 7.
Mean values of CK13 immunolabelling area measured by ImageJ software (n = 2). NC group: healthy and untreated animals; control group: infected animals that did not receive any treatment (C − L−); C + L+, AC + L+, and CC + L+ groups: animals treated with aPDT mediated by free CUR, anionic and cationic CUR-NP, respectively, and blue LED light; C + L−, AC + L−, and CC + L− groups: evaluation of each PS alone (free CUR, and anionic and cationic CUR-NP, respectively); NYS1 and NYS4 groups: animals treated with Nystatin 100,000 IU once (under anesthesia) and four times daily, respectively. Error bars: standard deviation.

