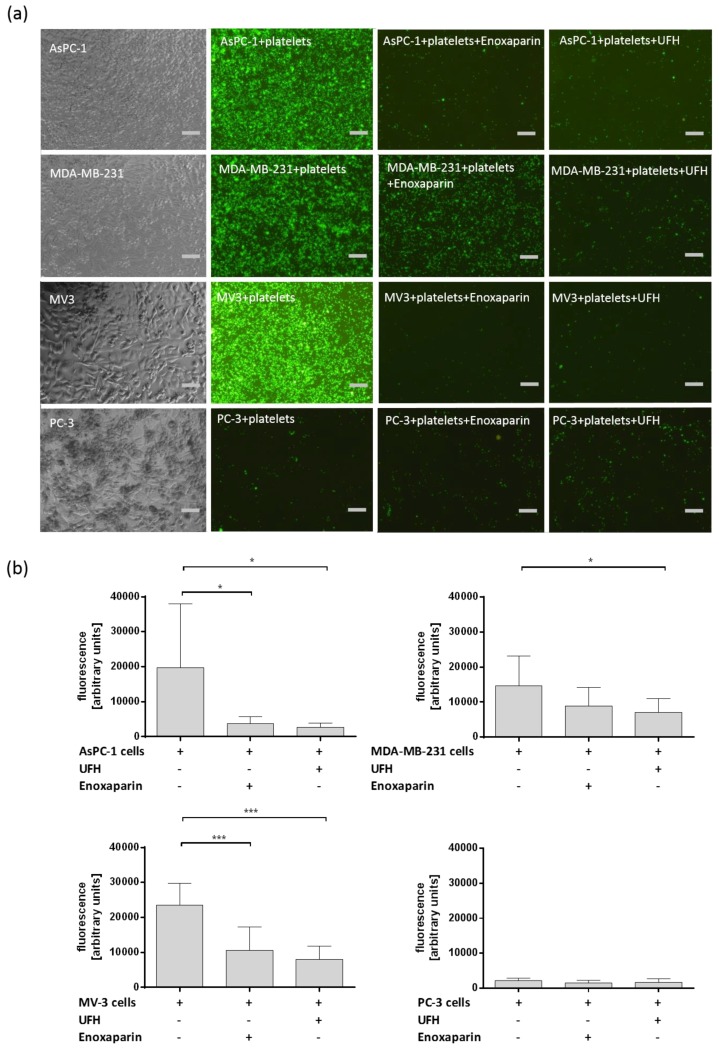
Figure 1.
(a) Representative pictures of Calcein-AM labeled platelets interacting with confluent layers of AsPC-1, MDA-MB-231, MV3 and PC-3 cells. Prior to interaction platelets were coincubated with 1 IU/mL UFH or 1 IU/mL enoxaparin. Scale bar corresponds to 50 µm. (b) Quantification of platelet (Calcein-AM labeled) tumor cell (AsPC-1, MDA-MB-231, MV3 and PC-3) by fluorescent plate reader assay. Data are means of at least n = 3 (±SD), asterisks indicate statistical significance: * p ≤ 0.05; *** p ≤ 0.001.

