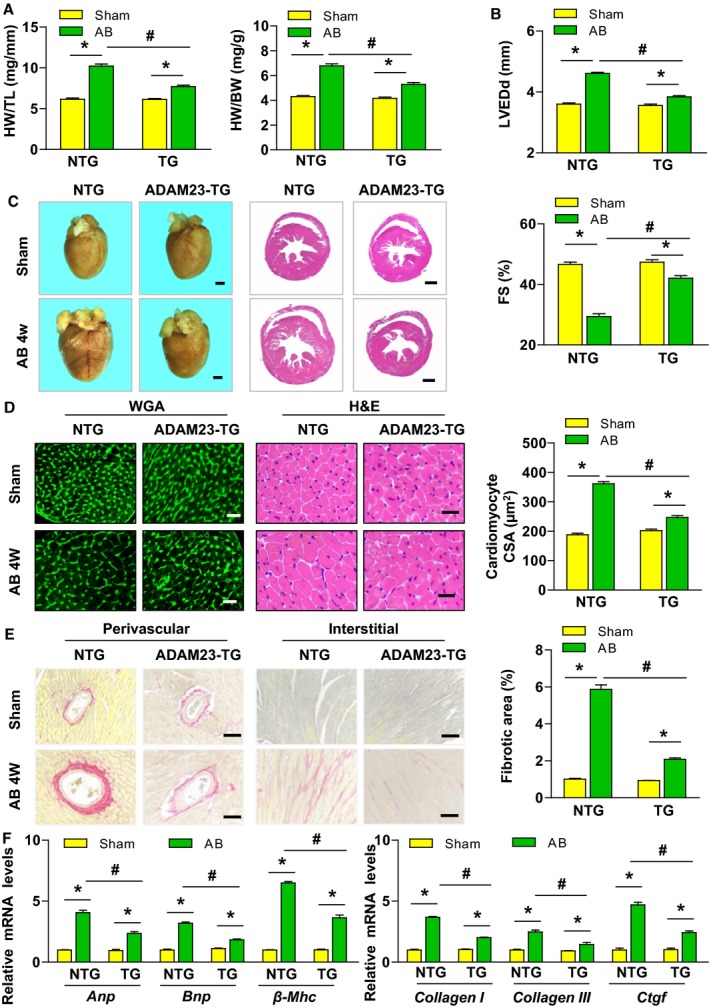
Figure 3.

Cardiac ADAM23 overexpression attenuates aortic banding (AB)‐induced hypertrophy. A, Comparison of the HW/TL, and HW/BW ratios in different genotypic mice after sham or AB surgery (n=11 mice for NTG sham group, n=13 mice for TG sham group and NTG AB group, n=12 mice for TG AB group). B, Comparison of the echocardiographic parameters LVEDd and FS in the indicated groups (n=11 mice for NTG sham group, n=13 mice for TG sham group and NTG AB group, n=12 mice for TG AB group). C, Histological analysis of heart sections stained with H&E and WGA staining, and statistical results for the cardiomyocyte CSA) in both NTG and ADAM23‐TG groups (n=6 mice per group; scale bar, 1 mm). D, Representative images of heart sections stained with H&E and WGA staining, and statistical results for the cardiomyocyte CSA (n>100 cells per group; scale bar, 20 μm). E, Representative images of cardiac perivascular and interstitial fibrosis, and statistical results for the fibrotic area (n>40 fields per group; scale bar, 20 μm). F, Quantification results for mRNA levels of the hypertrophic marker genes (Anp, Bnp and, β‐Mhc) and fibrotic marker genes (collagen I, collagen III, and Ctgf) in the indicated groups (n=4 independent experiments). ANP indicates atrial natriuretic peptide; CSA, cross‐sectional area; DCM, dilated cardiomyopathy; FS, fractional shortening; H&E, hematoxylin and eosin; HCM, hypertrophic cardiomyopathy; HW/TL, heart weight to tibia length; HW/BW, heart weight to body weight; LVEDd, left ventricular end‐diastolic diameter; NTG, nontransgenic; TG, transgenic; WGA, wheat germ agglutinin. *P<0.05 vs sham; # P<0.05 vs NTG AB group in (A, B, D through F).
