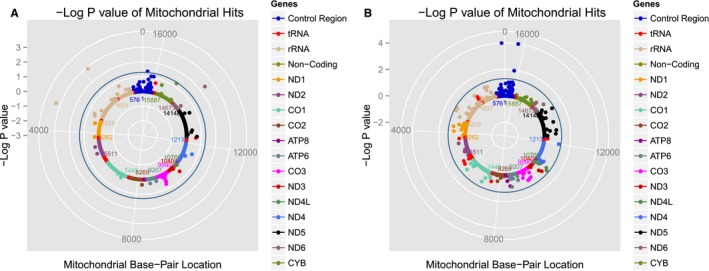
Figure 1.

Solar plots representing mitochondrial DNA (mtDNA) variant associations with systolic blood pressure (SBP) among white (A) and black (B) participants from the LIFE (Lifestyle Interventions and Independence for Elders) and Health ABC (Health, Aging, and Body Composition) studies. Each dot represents an mtDNA variant association with SBP color‐coded by mitochondrial gene. The blue circle represents P=0.05. rRNA indicates ribosomal RNA; tRNA, transfer RNA.
