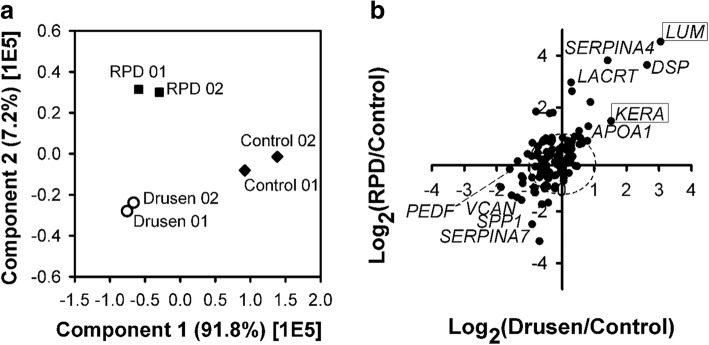
Fig. 5.
(a) Principal component analysis (PCA) of quantified AH proteins from drusen, RPD, and healthy control samples. (b) 2D-plot of the relative abundance of AH proteins quantified from drusen and RPD patients versus healthy controls. Upregulated proteins are shown in the upper right quadrant and downregulated proteins in the lower left quadrant for both drusen and RPD samples. The dashed line indicates the boundary of changes in abundance according to the 2-fold criterion. Proteins indicated with boxes are new biomarker candidates in dry AMD patients

