
Figure 3.
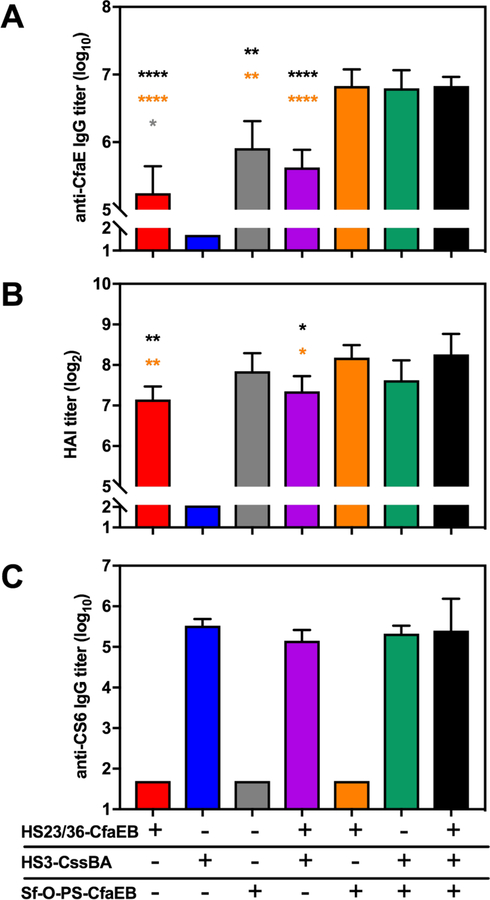
ETEC antibody responses following immunization with multivalent conjugate vaccines. Protein-specific IgG and HAI responses were measured after three immunizations of monovalent, bivalent or a trivalent formulation of three polysaccharide conjugate vaccines. A) Anti-CfaE IgG responses were measured by ELISA. B) Functional HAI titers were measured against H10407. C) anti-CS6 IgG responses were measured by ELISA. Bars represent the mean plus standard deviation of the log10 or log2 transformed titers. Statistical significance was determined using a one-way ANOVA including groups for which individual mouse titers were measured. Symbols denote multiplicity adjusted P values between groups where the color of symbol above the respective bar represents the group that is significantly different. Grey: significantly different from Sf-O-PS-CfaEB. Orange: significantly different from HS23/36-CfaEB + Sf-O-PS-CfaEB. Black: significantly different from the trivalent formulation. * p ≤ 0.05, ** p ≤ 0.001, ****p < 0.0001.