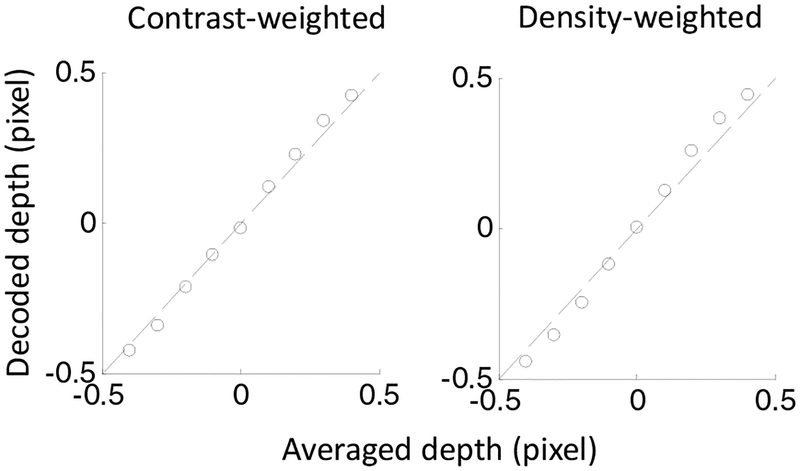
Figure 11:
Disparity averaging weighted by dot contrasts and dot density. We applied our model to a transparent random-dot stereogram with two planes at ±0.5 pixel of disparities, and varied the contrast (left panel) and density (right panel) of the dots of the two planes. Each panel plots the computed disparity against the average disparity weighted by the contrast (left) or density (right).

