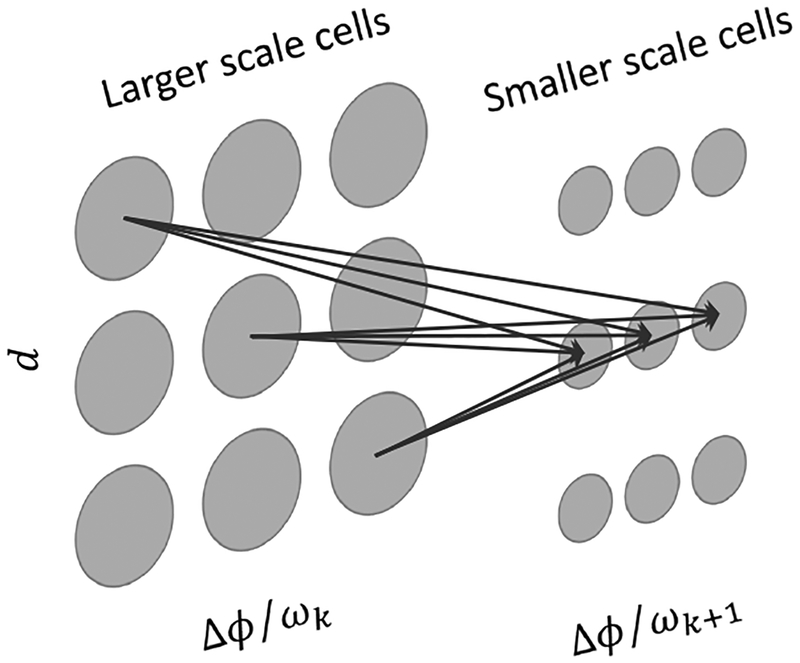
Figure 2:
Schematic drawing of the multiplicative connections from cells of a larger scale to cells of the next smaller scale (Eqn. 14). For each scale and image location, the cells are indexed by their position-shift and phase-shift parameters. To avoid clutter, only the strongest connections from three pre-synaptic cells to three post-synaptic cells are shown. The three pre-synaptic cells lie on a negative diagonal line and thus have the same total preferred disparity (Eqn. 10). The three post-synaptic cells have the same position shift equal to the pre-synaptic cells’ total preferred disparity. Each cell’s RFs also receive inputs from stimuli (not shown) to compute energy responses.

