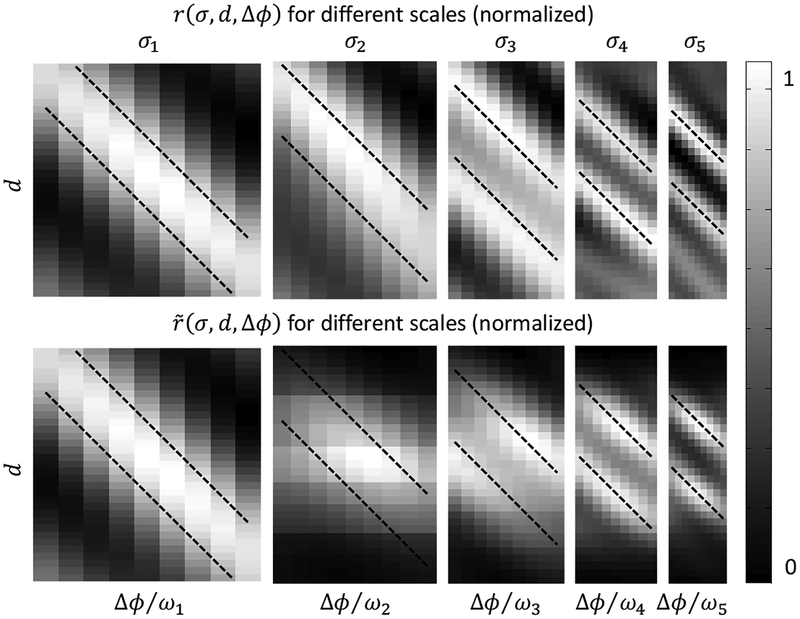
Figure 3:
The energy responses (top row) and the responses multiplied by the coarse-to-fine gains (bottom row) at a fixed position in the transparent random-dot stereogram of Fig. 1. Different columns show results from different scales. In each panel, the horizontal axis represents the cells’ phase-shift parameter Δϕ (divided by ω to covert to disparity), and the vertical axis represents their position-shift parameter d. Dotted lines indicate combinations of phase and position shifts that equal the true disparities of the stimulus.

