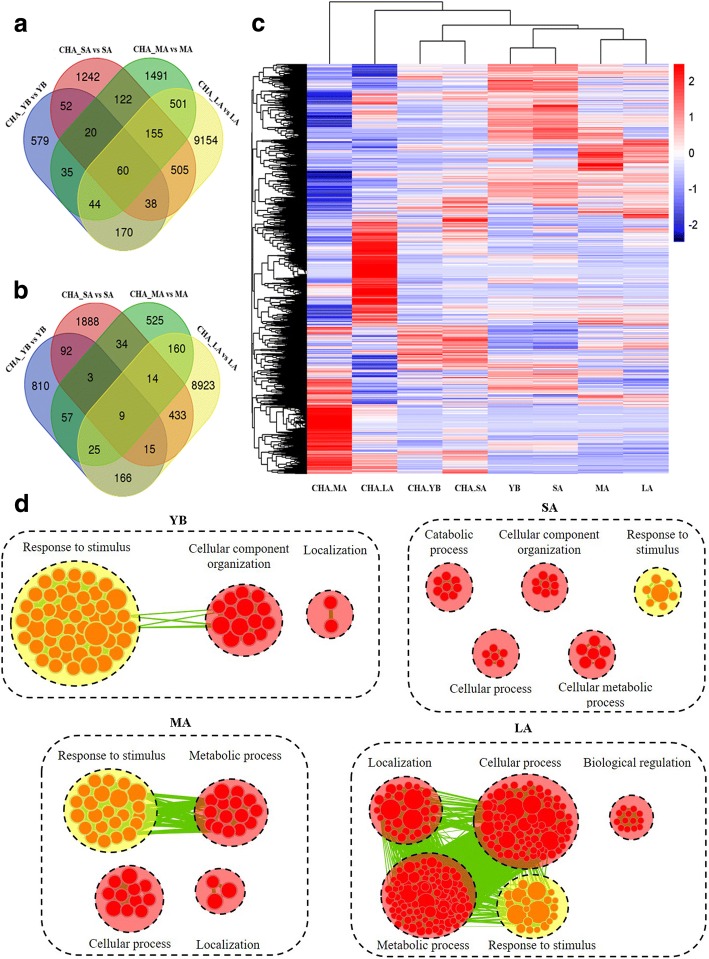
Fig. 5.
The heatmap for the DEGs between CHA treated materials and control and biological process analysis of down-regulated DEGs. a, Up-regulated genes. b, Down-regulated genes. c, The heatmap analysis of all DEGs at different stage. d, The yellow and red circles indicate the common and different biological processes among the four stages

