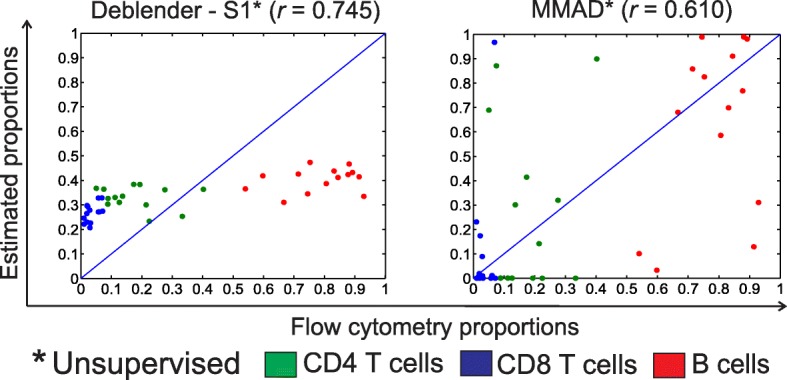
Fig. 6.

GSE65135 dataset with 14 mixed samples including 3 cell types (CD4 T cells, CD8 T cells and B cells). Evaluation of the unsupervised mode of Deblender* (default preprocessing – S1) and MMAD* (default percentile) relative to flow cytometry proportions. Pearson correlation (r) results per cell type, Deblender*: CD4 T cells: -0.178, CD8 T cells: 0.535, B cells: 0.266, MMAD: CD4 T cells: 0.099, CD8 T cells: 0.301, B cells: 0.352
