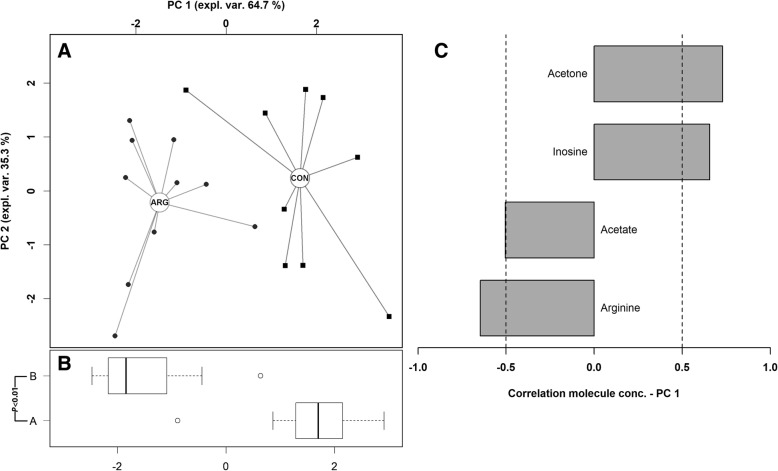
Fig. 3.
Robust Principal Component Analysis on breast metabolites showing differential expression between CON and ARG groups. CON, n = 9; digestible Arg:Lys = 1.05, 1.05, 1.06 and 1.07 in starter, grower I, grower II and finisher feeding phase, respectively. ARG, n = 9; digestible Arg:Lys = 1.15, 1.15, 1.16 and 1.17, respectively. a In the scoreplot, samples from chickens fed different diets are represented with squares and circles respectively. The wide, empty circles represent the median of the samples at the various time-points. b Boxplot summarizing the position of the subjects along PC 1. c Loadingplot reports the correlation between the concentration of each substance and its importance over PC 1. Highly significant correlations (P < 0.05) are highlighted with gray bars

