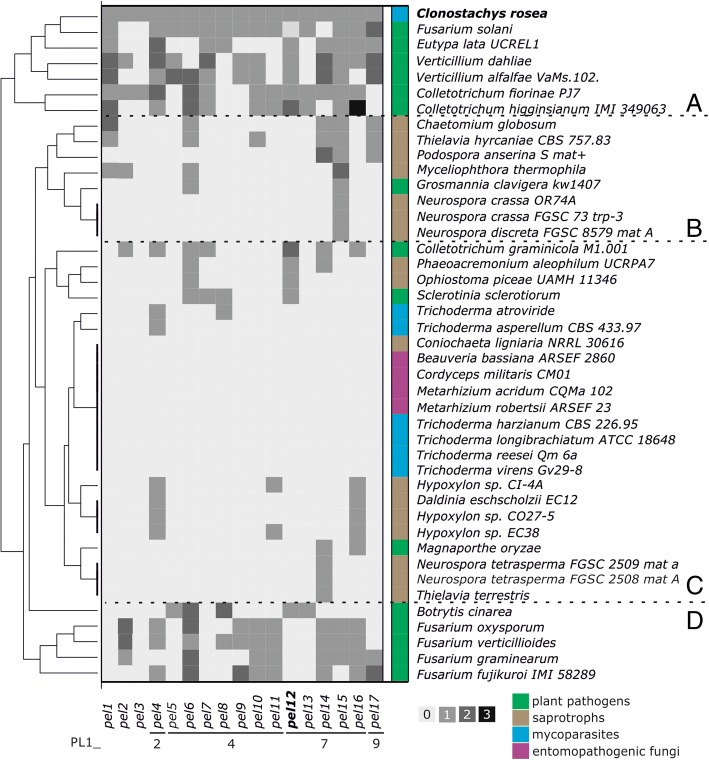
Fig. 1.
Hierarchical clustering based on PL1 gene content in Sordariomycetes and Botrytis cinerea and Sclerotinia sclerotiorum (Leotiomycetes). The clusters are marked with letters A to D. The squares colored with four different shades of gray represent the number of C. rosea orthologs per species. The color annotation on the right marks the nutritional mode of fungi

