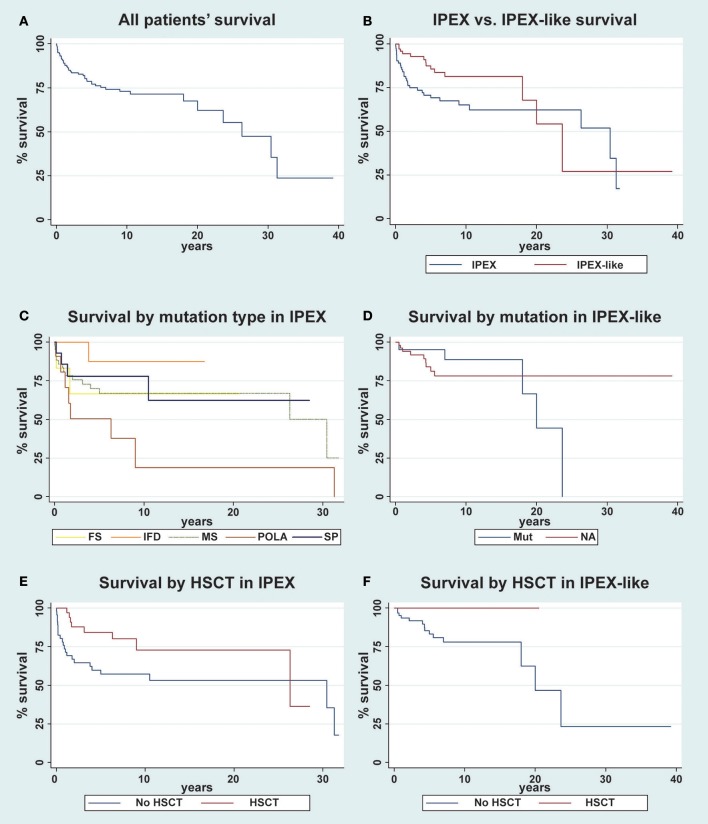
Figure 8.
Kaplan-Meier survival curve for overall survival of patients. (A) The overall survival in the whole cohort of patient is evaluated (n = 163); (B) IPEX (n = 85) vs. IPEX-like (n = 78) patients are compared; (C) IPEX patients stratified for type of mutation: frameshift (FS) n = 6, in frame deletion (IFD) n = 11, missense (MS) n = 43, splicing mutations (SP) n = 14 and mutations in polyadenylation site (POLA) n = 11 are compared; (D) IPEX-like without mutations (NA= not available) n = 57 and IPEX-like with mutation (Mut) n = 21 are compared; (E) IPEX patient stratified whether (n = 39) or not (n = 46) they underwent HSCT and (F) IPEX-like patient stratified whether (n = 10) or not (n = 68) they underwent HSCT.

