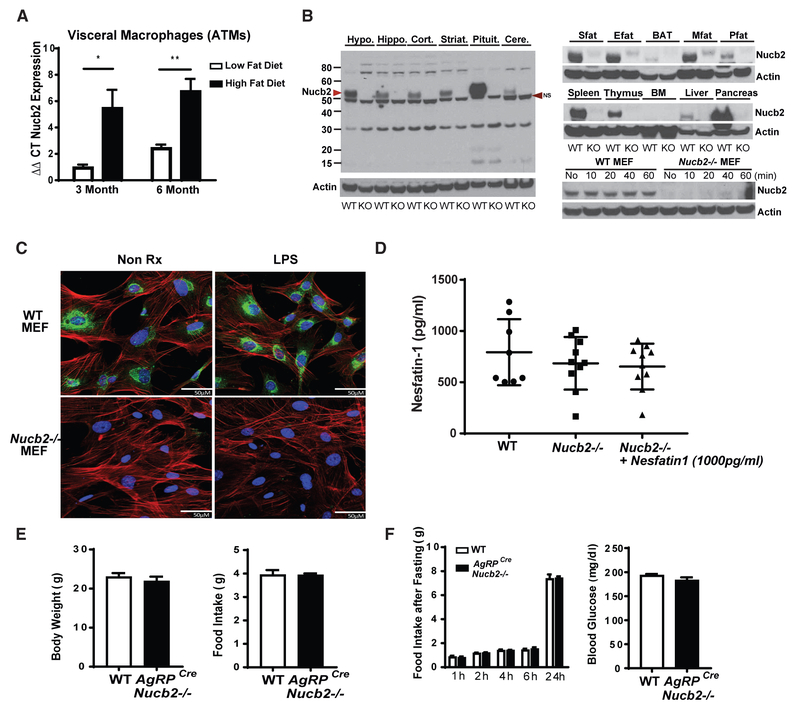
Figure 1. Nucleobindin-2 Is Not a Physiological Regulator of Food Intake.
(A) Real-time PCR analysis of Nucb2 mRNA in F4/80+ visceral ATMs derived from mice fed a 60% HFD for 3 and 6 months (n = 6 per group; *p<0.05, **p<0.01.) (Figure S1D).
(B) Immunoblot analysis of Nucb2 protein from different tissues of control and global Nucb2-deficient mice. The arrowhead on the left indicates the molecular weight of the Nucb2-specific band. NS, non-specific band. (See Figures S2A and S2B for mRNA expression in cells and organs of control and Nucb2−/− mice.)
(C) Representative confocal microscopy images of mouse embryonic fibroblasts (MEFs) from WT (top) and Nucb2−/− (bottom) mice with (right) and without (left) treatment of 1 μg/mL LPS for 1 hr, labeled for Nucb2 (green), F-actin (red), and nucleus (blue). Scale bars, 50 μM.
(D) ELISA of nesfatin-1 in plasma from WT and Nucb2-deficient mice and measurement of nesfatin-1 after the addition of 1,000 pg/mL peptide in plasma.
(E) Body weight (left) and food intake (right) of WT and AgRPCreNucb2−/− mice.
(F) Food intake over 24 hr after fasting and refeeding (left) and blood glucose levels after fasting (right) in control and Agrp-neuron-specific Nucb2-deficient mice (n = 12 per group).
See also Figures S1D and S2.

