
Figure 3:
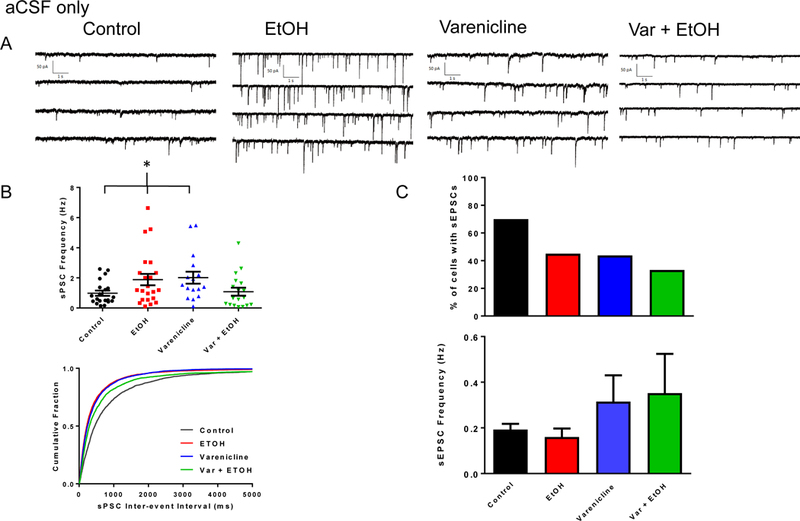
Binge-EtOH and varenicline treatments affect BF synaptic transmission in female rats. A. Representative traces of sPSCs from female rats across control, EtOH, varenicline alone, and var + EtOH treatments. B. (Top) Scatter plots of sPSC frequencies from recorded BF neurons across all treatment groups. Data are mean ± S.E.M. (Bottom) Cumulative probability plots of sPSC inter-event intervals from recorded BF neurons. (*) indicates statistical significance. C. (Top) Percent of BF neurons exhibiting sEPSCs across all treatment groups. (Bottom) Bar graph representation of sEPSCs across treatment groups. Data are mean ± S.E.M.