
Figure 3.
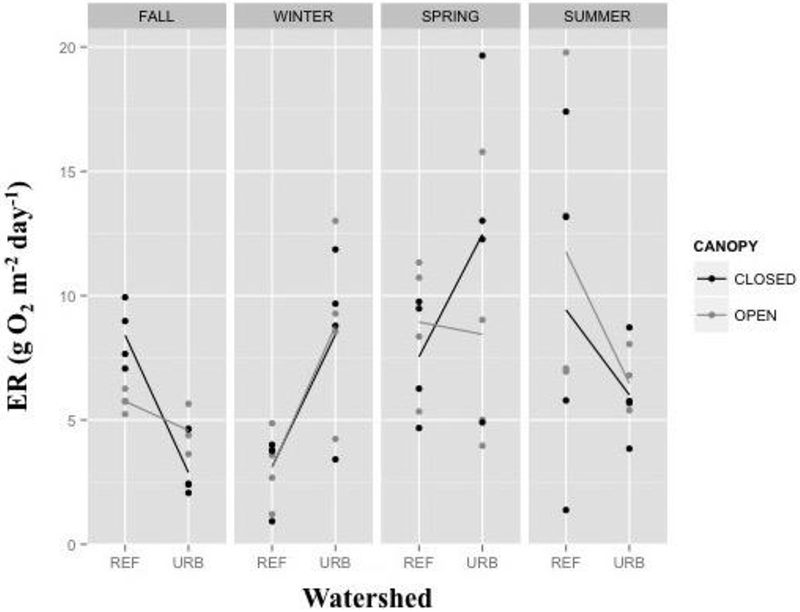
Rates of stream Ecosystem Respiration (ER) by watershed, canopy, and season. Dots represent the rate for individual study reaches during the specific sampling season. Lines connect the mean value for each canopy treatment by watershed type.