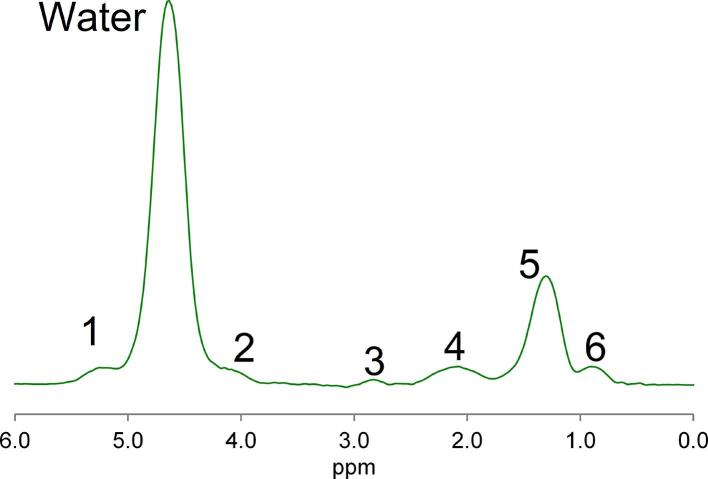
Figure 3.
Typical liver MR spectrum showing water peak at 4.7 ppm (chemical shift measured in ppm) and multiple fat peaks (Peaks 1–6). There is one main fat peak (Peak 5). There are also Peak 4 and Peak 6, which partially overlap with the main fat peak. Peak 1 and Peak 2 overlap with the single water peak. Different correction techniques exist in advanced MR to address the problem of teasing apart contributions from individual peaks. ppm, parts per million.

