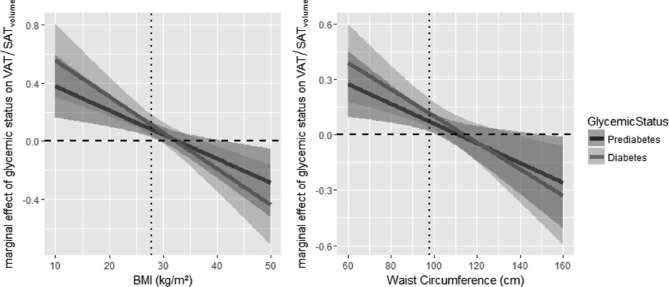
Figure 5.
Marginal effects of glycemic status on the ratio of VAT/SATvolume for multiplicative interactions with BMI (left) and waist circumference (right). Displayed are the marginal effects of prediabetes (solid line, dark gray) and diabetes (solid line, light gray) and the respective 95% confidence interval for a grid of possible values of BMI (range in data: 18.1–43.2 kg m–2) and waist circumference (range in data: 66.4–144.8 cm). The arithmetic mean is indicated by a dotted line. The dashed line indicates the line of no effect. BMI, body mass index; SAT, subcutaneous adipose tissue; VAT, visceral adipose tissue.

