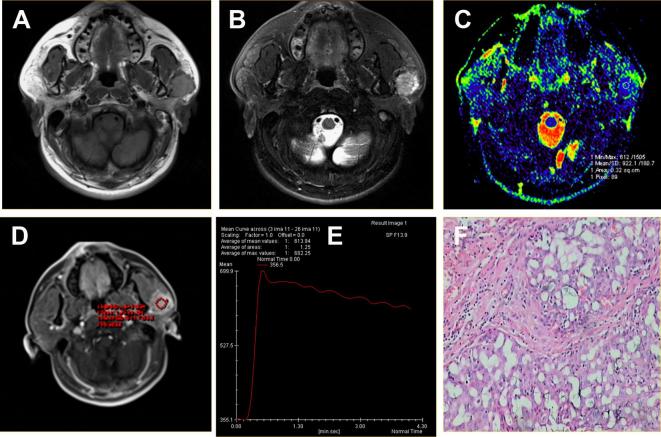
Figure 3.
Acinar cell carcinoma located in the superficial lobe of the left parotid gland of a 40-year-old male. (A) Axial T1WI showed a round mass with homogeneous isointense signal and unclear margin. (B) Axial T2WI sequences with fat suppression showed the lesions with hyperintense signal and radial hypointense signal shadow. (C) ADC map showed the mass alternated with blue signal. The ADC value was 0.92 × 10⁻³ mm2 s–1. (D-E) Time-signal intensity curve showed a plateau enhancement pattern (Type C). (F) HE staining: original magnification, 400×. ADC, apparent diffusion coefficient; HE, hematoxylin; T1WI, T1 weighted imaging; T2WI, T2 weighted imaging.

