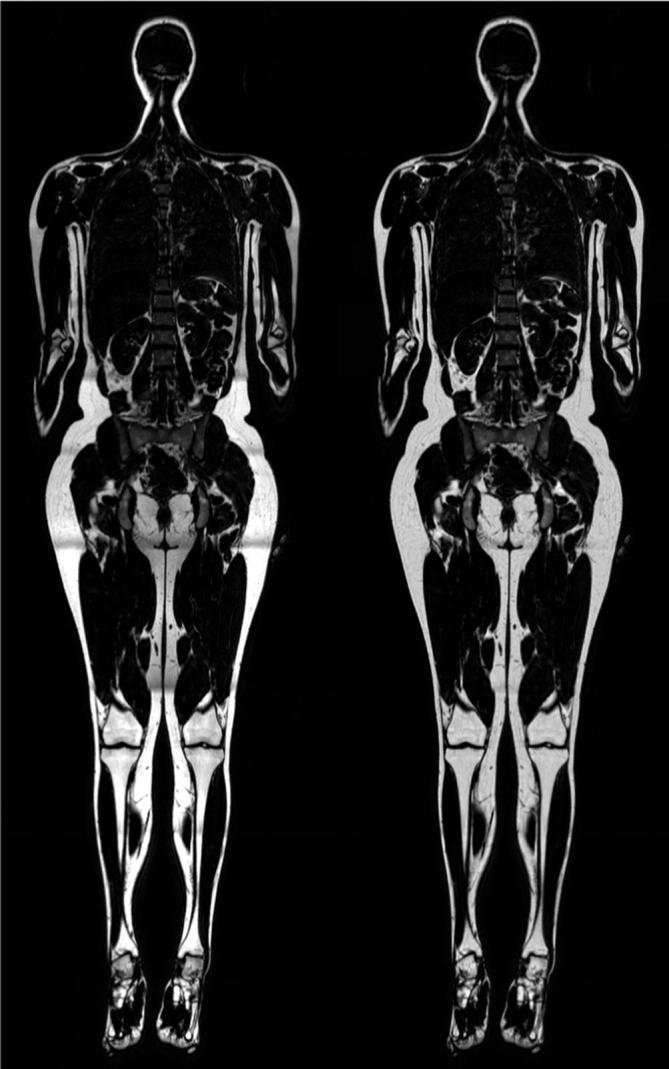
Figure 1.

Example of quantitative imaging. To the left is an original fat image acquired using 2-point Dixon fat-water separated imaging. To the right is the corresponding quantitative fat image after calibration using the fat-referenced method. Inhomogeneities in the intensity of adipose tissue can be observed in the original image (left) that are almost completely remove in the calibrated image (right).
