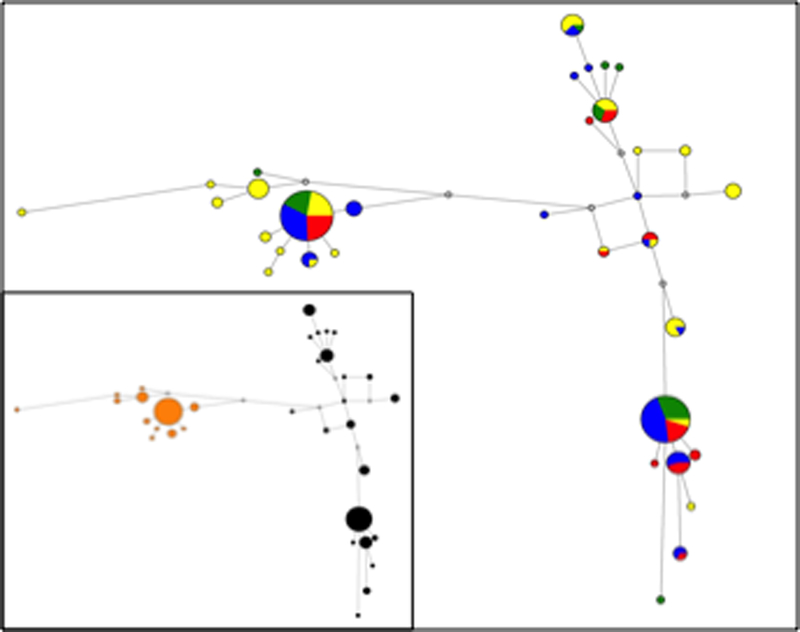
Fig. 4.

Reduced median network of GYPA haplotypes from sub-Saharan Africans (yellow), East Asians (green), Europeans (red), and South Asians (blue). Each circle represents a unique haplotype and the size of each circle corresponds to its frequency. Each grey circle represents a single inferred mutational step. The inset shows the same network typology, but with color-coding according to MN genotype, M (black) and N (orange).
