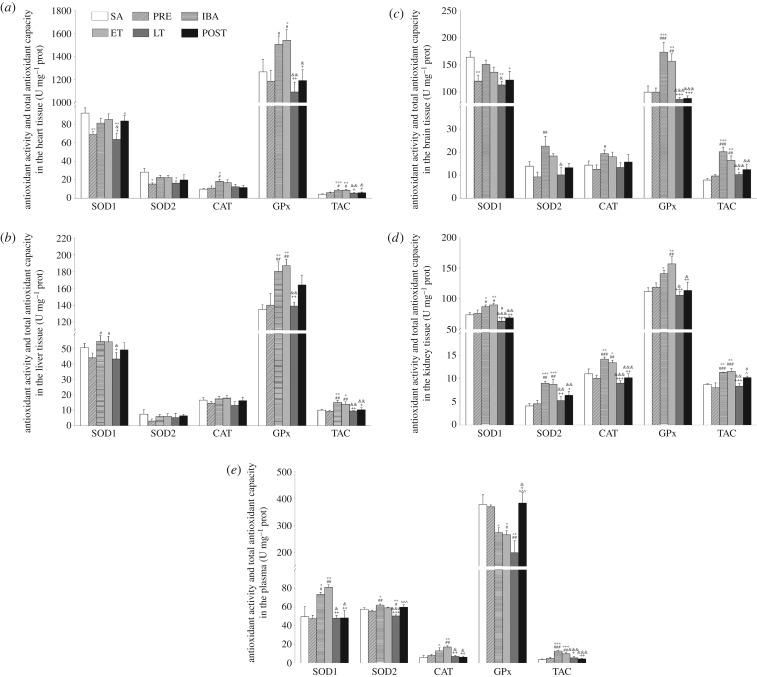
Figure 4.
Changes in activities of SOD1, SOD2, CAT, GPx1 and TAC in different tissues of S. dauricus over the course of a torpor–arousal cycle. (a) Activities of SOD1, SOD2, CAT, GPx and TAC in heart tissue during six hibernation periods. (b) Activities of SOD1, SOD2, CAT, GPx and TAC in liver tissue during six hibernation periods. (c) Activities of SOD1, SOD2, CAT, GPx and TAC in brain tissue during six hibernation periods. (d) Activities of SOD1, SOD2, CAT, GPx and TAC in kidney tissue during six hibernation periods. (e) Activities of SOD1, SOD2, CAT, GPx and TAC in plasma during six hibernation periods. SA, summer active; PRE, pre-hibernation; IBA, interbout arousal; ET, early torpor; LT, late torpor; POST, post-hibernation. Values are means ± s.e., n = 8; *p < 0.05, compared with SA; **p < 0.01, compared with SA; ***p < 0.001, compared with SA; #p < 0.05, compared with PRE; ##p < 0.01, compared with PRE; ###p < 0.001, compared with PRE; &p < 0.05, compared with IBA; &&p < 0.01, compared with IBA; &&&p < 0.001, compared with IBA; +p < 0.05, compared with ET; ++p < 0.01, compared with ET; +++p < 0.001, compared with ET; ^p < 0.05, compared with LT.

