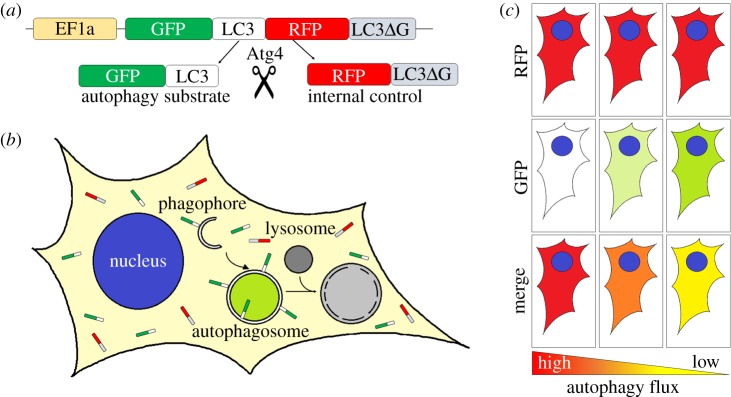
Figure 4.
Schematic diagram of the GFP-LC3-RFP-LC3DG reporter to measure autophagic flux. (a) Schematic diagram of the GFP-LC3-RFP-LC3DG reporter construct. The GFP-LC3-RFP-LC3DG protein is cleaved by ATG4 resulting in the release of GFP-LC3 and RFP-LC3DG in equimolar amounts. (b) GFP-LC3 becomes lipidated and binds to autophagosomes and autophagosome precursors, and can be visualized as green vesicles (puncta), whereas unlipidated RFP-LC3DG remains in the cytoplasm. The GFP signal is quenched when autophagosomes fuse to lysosomes to form autolysosomes. The green signal can therefore be used as a marker for phagophores and autophagosomes, but autolysosomes are not labelled. (c) Representative images of a cell expressing GFP-LC3-RFP-LC3DG with different levels of autophagy. The unlipidated RFP-LC3DG is released as an internal control at the same rate and amount as GFP-LC3 and always remains cytosolic. Levels of red signal are independent of autophagy degradation and remain unchanged upon autophagy perturbation. GFP-LC3, however, can be found unlipidated free in the cytoplasm or lipidated, hence bound to autophagic membranes, and therefore susceptible to autophagy degradation. Under high levels of autophagic flux, GFP-LC3 becomes lipidated and degraded, and thereby the level of green signal is reduced. When autophagy is blocked, the accumulation of unlipidated GFP-LC3 and the lack of degradation of the lipidated form results in an increase in the GFP signal. The ratio of the GFP:RFP (i.e. the green signal from GFP-LC3 and the unchanged mRFP-LC3DG) is then used to measure the rate of autophagic flux.

