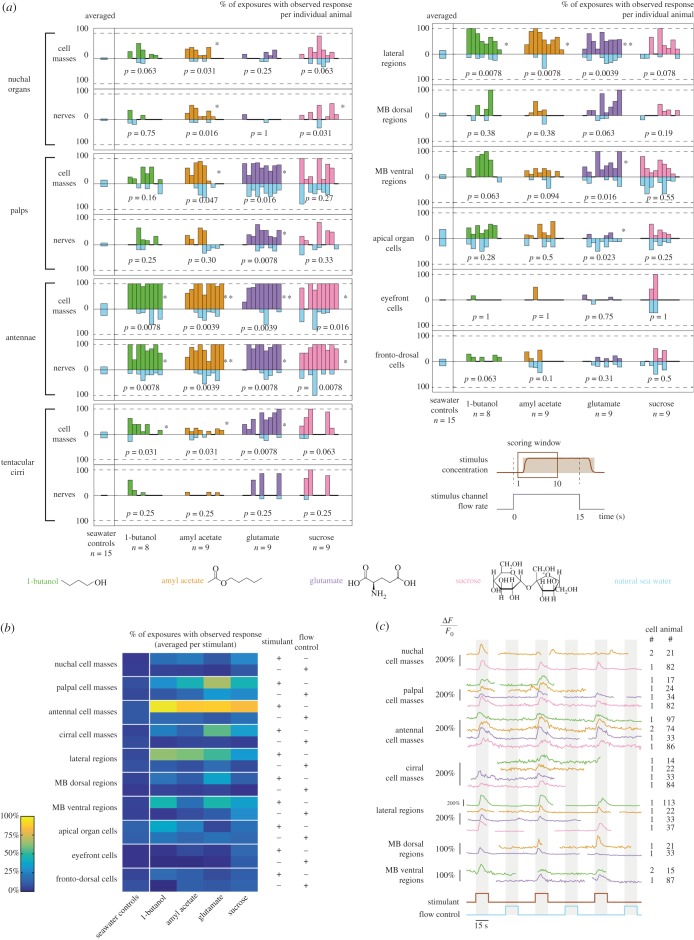
Figure 3.
Calcium responses of the active regions to the four stimulants. (a) Fractions of exposures with observed response for individual animals, shown as mirror barplots for chemical stimulants (green, orange, purple, pink) and flow controls (light blue). For each region, an averaged value obtained in control experiments is shown on the left (separate light blue barplots). p-Values and significance levels of a Wilcoxon signed-rank test between responses to chemical stimulants and to flow controls are shown (*p < 0.05, **p < 0.005). (b) Fractions of exposures with observed response, averaged per stimulant. (c) Calcium activity traces of individual cells; calcium snapshots and the corresponding regions of interest are shown in the electronic supplementary material, figure S4. Trace colours correspond to the stimulants used.

