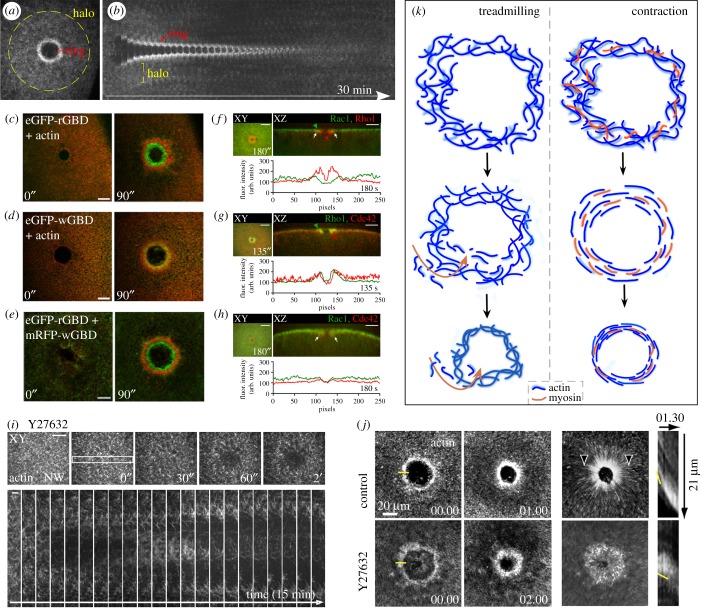
Figure 4.
Cytoskeletal responses in cell wound repair. (a,b) Confocal XY projection at 180 s post-wounding (a) and kymograph (b) of NC4-staged Drosophila embryo expressing a GFP-actin reporter. Actin accumulates in two regions adjacent to the wound: a highly-enriched actin ring abutting the wound edge (red bracket), and an elevated actin halo encircling the actin ring (yellow circle). Membrane plug is also indicated. Adapted and republished with permission of The Rockefeller University Press, from Nakamura et al.; permission conveyed through Copyright Clearance Center, Inc. [81] (Copyright © 2017). (c–e) XY projections of the surface of a laser-wounded Xenopus oocyte displaying concentric rings of RhoA activity (green) (c), Cdc42 activity (green) alongside injected fluorescent actin (red) (d), and RhoA activity (red) overlaid with Cdc42 activity (green) (e). Republished with permission of The Rockefeller University Press, from Benink & Bement; permission conveyed through Copyright Clearance Center, Inc. [24] (Copyright © 2005). (f–h) XY and YZ projections alongside localized staining intensities across the wound midline of wounded Drosophila syncytial embryos for Rac1 (green) and Rho1 (red) (f), Rho1 (green) and Cdc42 (red) (g) and Rac1 (red) and Cdc42 (green) (h). Positions of GTPase recruitment (green or red arrowheads) and of GTPase co-localization (white arrows) are indicated. Adapted and reprinted from Abreu-Blanco et al., with permission from Elsevier [27] (Copyright © 2014). (i) XY views and kymograph of laser-wounded Drosophila syncytial embryo expressing fluorescent actin reporters in the presence of Y27632. Adapted and republished with permission of The Rockefeller University Press, from Abreu-Blanco et al.; permission conveyed through Copyright Clearance Center, Inc. [26] (Copyright © 2011). (j) Time lapse images at 1 and 2 min after laser-wounded Xenopus oocytes following injection with control or Y27632 (Rok kinase inhibitor that prevents myosin-II activity) alongside a fluorescent actin reporter (left). Brightest points projection across experimental time representing cortical flow alongside a kymograph demonstrating wound closure (right). Yellow line at time 00:00 represents position of kymograph. Yellow line in kymograph identifies position of the leading edge. Adapted and reprinted from Burkel et al., with permission from Elsevier [25] (Copyright © 2012). (k) Schematic depicting XY view of actomyosin dynamics following wounding in the actin treadmilling and contraction wound closure models.

