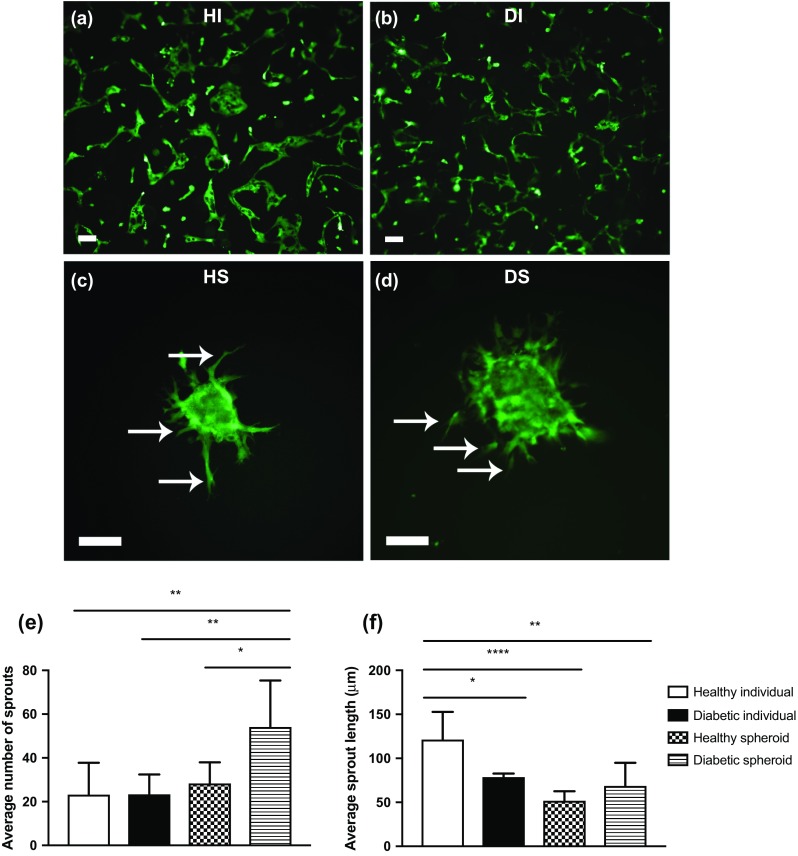
Figure 3.

HMVEC spheroids exhibit increased sprouting compared to individual HMVECs when entrapped in fibrin gels. Representative fluorescence imaging of individual (a) healthy and (b) diabetic HMVECs entrapped in fibrin gel for 24 h. Representative fluorescence imaging of (c) healthy and (d) diabetic HMVEC spheroids entrapped in fibrin gel for 24 h. Scale bars represent 100 μm at a ×10 magnification, and sprouts are denoted by white arrows. (e) Quantification of sprouts from HMVEC spheroids. (f) Quantification of average sprout length of HMVEC spheroids. Chart values represent mean ± standard deviation (n = 6; *p < 0.05; **p < 0.01; ****p < 0.0001). HI healthy individual, DI diabetic individual, HS healthy spheroid, DS diabetic spheroid.
