
Figure 4.
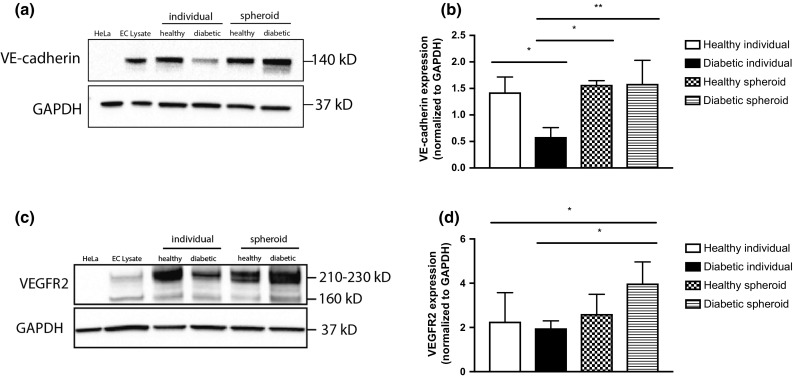
VE-cadherin and VEGFR2 expression are increased in diabetic HMVEC spheroids. (a) Western Blot of VE-cadherin expression in HMVECs as individual cells or spheroids after formation. (b) Quantification of VE-cadherin densitometry. Chart values represent mean ± standard deviation (n = 3; *p < 0.05; **p < 0.01). (c) Western Blot of VEGFR2 expression in HMVECs as individual cells or spheroids. (d) Quantification of VEGFR2 densitometry. Chart values represent mean ± standard deviation (n = 5; *p < 0.05). HeLa HeLa cells, EC lysate endothelial cell lysate.