Abstract
Objective:
To investigate the value of multi-ultrahigh-b-value diffusion-weighted imaging (UHBV-DWI) in differentiating high-grade astrocytomas (HGAs) from low-grade astrocytomas (LGAs), analyze its association with aquaporin (AQP) expression.
Methods:
40 astrocytomas divided into LGAs (N = 15) and HGAs (N = 25) were studied. Apparent diffusion coefficient (ADC) and UHBV-ADC values in solid parts and peritumoral edema were compared between LGAs and HGAs groups by the t-test. Using receiver operating characteristic curves to identify the better parameter. Using real time polymerase chain reaction to assess AQP messenger ribonucleic acid (mRNA). Using spearman correlation analysis to assess the correlation of AQP mRNA with each parameter.
Results:
ADC values in solid parts of HGAs were significantly lower than LGAs (p = 0.02), while UHBV-ADC values of HGAs were significantly higher than LGAs (p < 0.01). Area under the curve (AUC) of UHBV-ADC (0.810) was larger than ADC (0.713), and the area under the curve of UHBV-ADC was significantly higher than that of ADC (p = 0.041). AQP4 mRNA was significantly higher in HGAs than that in LGAs (p < 0.01); there was less AQP9 mRNA and no AQP1 mRNA in LGAs and HGAs groups (p > 0.05); ADC value showed a negative correlation with AQP4 mRNA (r = −0.357; p = 0.024). UHBV-ADC value positively correlated with the AQP4 mRNA (r = 0.646; p < 0.01).
Conclusion:
UHBV-DWI allowed for a more accurate grading of cerebral astrocytoma than DWI, and UHBV-ADC value may be related with the AQP4 mRNA levels. UHBV-DWI could be of value in the assessment of astrocytoma.
Advances in knowledge:
UHBV-DWI generated by multi UHBV could have particular value for astrocytoma grading, and the level of AQP4 mRNA might be potentially linked to the change of UHBV-DWI parameter, and we might find the exact reason for the difference of UHBV-ADC between the LGAs and HGAs.
Introduction
Astrocytomas are the most common type of primary cerebral tumors. Accurate pre-treatment grading of astrocytomas is important to facilitate pretreatment decision making. Although it is known that higher cellularity in high grade gliomas results in lower apparent diffusion coefficient (ADC) values than those of low-grade gliomas,1, 2 diffusion weighted imaging (DWI) at a standard b-value (b = 1000 s mm–2) barely differentiates high-grade and low-grade gliomas in many cases. This is because of overlapping signal intensities on DWI and ADC maps.3, 4
Recently, high-b-value DWI (HBV-DWI) was shown to improve the diagnostic performance of DWI in the detection of high grade gliomas and prostate cancer.5, 6 Seo HS showed that DWI at b = 3000 s mm–2 is more useful than DWI at b = 1000 s mm–2 for discriminating high-grade from low-grade gliomas.5 Yamasaki F showed that high b-value DWI reflects cell density more accurately than regular b-value DWI.6 But the single high b value DWI was also not accurate enough. Recently Ling HY used a tri-component model to calculate ultra-HBV ADC (UHBV-ADC) generated by five multi UHBV (2000–5000 s mm–2), which provided a useful measure of brain damage in patients with Parkinson’s disease. He speculated that UHBV-ADC may reflect water transportation by aquaporin (AQP).7 But the exact reason for this difference is not confirmed in the study.
AQP plays an important role in the maintenance of water and electrolyte homeostasis. Many studies report that high-grade astrocytomas (HGAs) had significantly more AQP than low-grade astrocytomas (LGAs). It is thought to be involved in tumorigenesis, especially in modulating changes in cell migration and cytoskeleton organization.8 We hypothesized that UHBV-DWI generated by multi UHBVs might have particular value of astrocytoma grading assessment, and that AQP expression might be potentially related to the change in UHBV-DWI parameter, which might be the exact reason for the difference of UHBV-ADC between HGAs and LGAs.
In this study, we analyzed the UHBV-ADC value generated from five UHBVs in the grading of astrocytomas, assessed the correlation between UHBV-ADC value and AQP expression.
Methods and materials
Patients
The institutional review board at our Medical University approved the study protocol, and written informed consent was waived. Inclusion criteria were as follows: newly confirmed astrocytoma by pathology according to 2016 World Health Organization (WHO) Classification of Tumors of the Central Nervous System; available surgical specimens stored at −80 °C; patients had MRI examination including multi-b-values DWI and traditional DWI sequences. Exclusion criteria: pre-operative therapy (radiotherapy, chemotherapy or chemoradiotherapy) or recurrent astrocytomas which may change the nature of tumor; totally cystic astrocytomas which were difficult to draw regions of interest (ROIs) of tumoral solid part. Totally, 40 patients with cerebral astrocytomas were collected between January 2014 and December 2015. Tumors were graded by the 2016 World Health Organization Classification of Tumors of the Central Nervous System. Patients were divided into two groups including LGAs (N = 15) (Grades I and II), and HGAs (N = 25) (Grades III and IV).
The study population comprised of 18 males and 22 females, mean age was 51.56 years and ranged from 29 to 76 years). Mean age of patients in the HGAs and LGAs groups was 48.6 ± 11.4 and 54.5 ± 11.0 years, respectively. The age between the two groups did not show significant difference (p = 0.118).
MRI data acquisition
All MRI examinations were performed by a 3.0 T MRI scanner (GE Signa HDxt) with an eight-channel array coil. The MRI sequences included conventional MRI scan [T1 weighted images (T1WI), T2 weighted images (T2WI), T2 fluid-attenuated inversion recovery (T2FLAIR) images, and contrast-enhanced T1WI (CE-T1WI)]. The parameters of these sequences were: echo time (TE) was 4.76 ms and repetition time (TR) was 195 ms for T1WI and CE-T1WI; TE was 98 ms and TR was 4000 ms for T2WI; and TE was 95 ms, TR was 8000 ms, and time of inversion was 2371.8 ms for T2 FLAIR.
Thickness and slice interval were 5.0, 1.0 mm, respectively; field of view (FOV) was 240 × 240 mm2. 0.1 mmol kg–1 body weight of Gd-diethylenetriaminepentaacetic acid was used for contrast enhancement. Echo planar imaging gradient echo sequence was used to get UHBV-DWI and DWI data. UHBV-DWI sequence was performed with five different b-values (1800, 2500, 3000, 3500 and 4000 s mm–2). Distributed directions were three.
The following imaging parameters were kept constant throughout the UHBV-DWI data acquisition: TE/TR : 115.5/3000 ms; FOV 240 × 240 mm2; matrix, 128 × 128; number of excitations (NEX): 1; section thickness, 5 mm; slice interval, 1 mm. Parameters for DWI data: b = 0 and 1000 mm2 s–1; TE/TR : 87/3000 ms; FOV: 240 × 240 mm2; matrix: 128 × 128; thickness 6 mm; slice interval 1 mm; number of excitations: 2.
MRI data processing and analysis
All DWIs data were transferred to a GE Advanced Workstation 4.4. UHBV-DWI software in GE Functool 9.4.05a was used to perform UHBV-DWI analysis.
The ADC map was calculated from the DWI sequence, using the monoexponential model by fitting b values (0, 1000 s mm–2) to equation (1):
where S is the diffusion-weighted signal intensity for the b-value, and S0 is the signal intensity obtained with the b 0-value.
UHBV-ADC is calculated by fitting the five UHBVs (1800, 2500, 3000, 3500, 4000 s mm–2) to equation (2).7
Conventional MRIs were used to show the basic features of astrocytomas such as tumoral solid parts, necrotic, cystic and hemorrhagic components, tumor boundary, and edema area, which were used to determine the ROIs. ROIs were manually drawn on the solid parts of the tumors and peritumoral edema with supporting workstation processing software. ADC and UHBV-ADC values were measured. The ROIs were drawn on one conventional image and automatically marked on UHBV-DWI (UHBV-ADC) and DWI (ADC) images by the UHBV-DWI software in GE Functool 9.4.05a in GE Advanced Workstation 4.4.
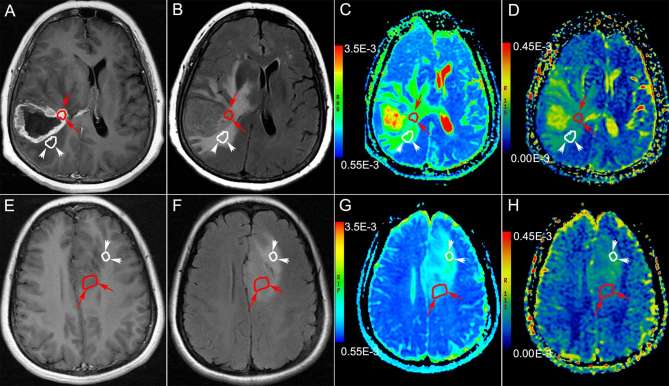
Criterion for the selecting ROIs of solid parts of the tumors. ROIs of enhanced tumors, were delineated on the enhanced parts of the tumors on transverse CE-T1 WI images by excluding the necrotic, cystic, or hemorrhagic components and the adjacent normal brain tissue(Figure 1a–d). ROIs of the unenhanced tumors were delineated on the transverse T2 FLAIR images (Figure 1e–h), by excluding adjacent normal brain tissue and peritumoral edema according to T2 FLAIR and DWI images. The signal intensity of solid part was lower than that of edema on T2 FLAIR images, and higher on DWI images. If the intensity of the solid part of the tumor was uneven on DWI, we used ADC map to define the ROI of solid parts of the tumors, the lowest ADC intensity area will be the ROI.9
Figure 1.
Examples for the selection of ROIs. (a–d): Brain MRI of a 56-year-old male with Grade IV astrocytoma in the right temporal lobe. The ROI in the solid part of enhanced tumor (the long arrow heads and curve ) and peritumoral edema (the short arrow heads and white curve ) are delineated on enhanced T1WI (a), T2FLAIR (b), ADC (c), UHBV-ADC (d). (e–h): Brain MRI of a 44-year-old female with Grade II astrocytoma in the left frontal lobe. The ROIs in the solid part of unenhanced tumor (the red curve and arrow heads) and peritumoral edema (the white curve and arrow heads) are delineated on enhanced T1 WI (e), T2 FLAIR (f), ADC (g), UHBV-ADC (h). ADC, apparent diffusion coefficient; ROI, region of interest; T1 WI, T1 weighted image; T2 FLAIR, T2 fluid-attenuated inversion recovery image; UHBV-ADC, ultra-high-b-value-ADC.
ROIs of peritumoral edema were selected on transverse CE-T1 WI images according to T2 FLAIR. The ROIs were delineated on the middle area of peritumoral edema by excluding cerebrospinal fluid and adjacent normal brain tissue, which prevented the cerebrospinal fluid contamination and partial volume effect (Figure 1).9
Two independent radiologists (a neuroradiologist with 15 years of experience, and a neuroradiologist with 8 years of experience), who were blinded to the AQP results, performed ROI selection and measured each parameter value three times based on the criterion for the selection of ROIs, followed by calculating the total mean ± standard deviation.9
AQP4 mRNA analysis
40 patients underwent tumor resection. Total ribonucleic acid (RNA) was extracted using the Trizol reagent (Sigma–Aldrich) according to standard protocol. Reverse transcription was performed with 2 µg total RNA and real time polymerase chain reaction (RT-PCR) was conducted with a QuantiTect SYBR Green RT-PCR Kit (Promega, Wisconsin of USA), according to the manufacturer’s recommendation. Gene-specific primers for human AQP1, AQP4, AQP9 and β-actin were designed using the Primer Premier software (Premier Biosoft International, Palo Alto, CA) as listed in Table 1.
Table 1.
AQP gene-specific primers for human
| Primer | Sequence | Length (bp) |
| AQP-1 | F:5′ CAGCGGCCAGGTGGAGGAGTAT 3′ | 178 |
| R:5′ CTTTGGCCAGCTTGTCAGAGTGTC 3′ | ||
| AQP-4 | F:5′ CGGTGCTAGGAAAGAGTGATGTGT 3′ | 168 |
| R:5′ CCAGCCAGGAAGTAACTATGTGTC 3′ | ||
| AQP-9 | F:5′ ATTGCCATCGGCCTCCTGATTAT 3′ | 199 |
| R:5′ GGCCTCCAATGACAGCACCAAC 3′ | ||
| β -Actin | F:5′ ATTCTGGGGATGGGGTCACTCACA 3′ | 200 |
| R:5′ CATCTCGCACAATCTCCCGCTCAG 3′ |
The reaction mixture was subjected to 40 cycles of PCR, including, a 10 min denaturation step at 95 °C. Each cycle consisted of denaturation at 95 °C for 10 s, annealment at 60 °C for 60 s, and a 15 s extension at 95 °C. PCR products were analyzed on 2% agarose gel electrophoresis.
Statistical analysis
Data analyses were performed by SPSS v. 18.0 statistical software (IBM company, USA). The differences between HGA and LGA with respect to DWI (ADC) and UHBV-DWI (UHBV-ADC) parameters in solid parts of the tumor and peritumoral edema were assessed using the t-test. Receiver operating characteristic (ROC) curves were generated for comparing the value of DWI (ADC) and UHBV-DWI (UHBV-ADC) parameters. The differences with respect to expression level of AQP1, AQP4 and AQP9 mRNA were assessed using the t-test. p < 0.05 was considered statistically significant. Spearman correlation analysis was performed to assess the correlation between AQP4 expression and each parameter (ADC and UHBV-ADC).
Results
UHBV-DWI and DWI parameters values
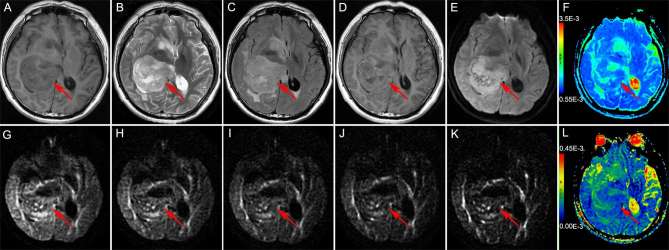
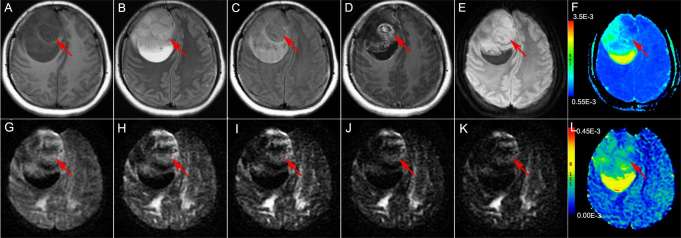
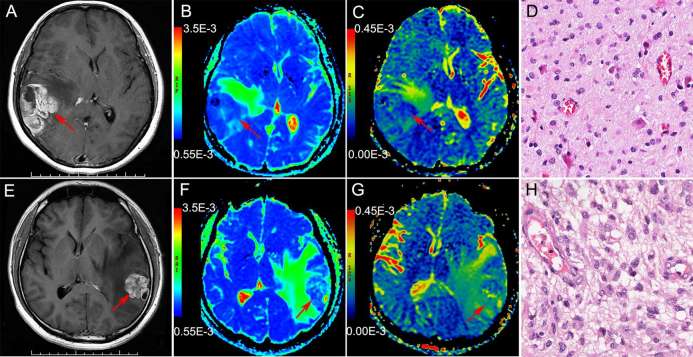
UHBV-DWI (UHBV-ADC) and DWI (ADC) parameter values of astrocytomas are shown in Figures 2–4 and Table 2. The ADC values in the solid parts of HGAs were significantly lower than those in the corresponding parts of LGAs (p = 0.02). The UHBV-ADC value generated by five multi-UHBVs (1800–4000 s mm–2) in the solid parts of HGAs was significantly higher than that of LGAs (p < 0.01). No significant difference was observed with respect to these values in peritumoral edema.
Figure 2.
Brain MRI of a 30-year-old male with Grade II astrocytoma in the right dorsal thalamus The solid part of the tumor (the red arrow head) is hypointense on T1WI (a) and shows mild hyperintensity on T2WI (b) and T2FLAIR (c); the solid part of the tumor shows mild enhancement on enhanced T1WI (d). The DWI (b = 1000 s mm–2) shows the solid part of the tumor as hyperintense (e); ADC value was 0.926 × 10⁻³ mm2 s–1 (f); the DWI [b = 1800 s mm–2 (g), b = 2500 s mm–2 (h), b = 3000 s mm–2 (i), b = 3500 s mm–2 (j), b = 4000 s mm–2 (k)] showed the solid part of the tumor as hypointense; the UHBV-ADC value was 0.0899 × 10⁻³ mm2 s–1 (l). ADC, apparent diffusion coefficient; T1WI, T1 weighted image, T2WI, T2 weighted image; T2 FLAIR, T2 fluid-attenuated inversion recovery image; UHBV-ADC, ultra-high-b-value-ADC.
Figure 3.
Brain MRI of a 25-year-old female with Grade IV astrocytoma in the right frontal lobe The solid part of the tumor (the red arrow head) appears hypointense on T1WI (a) and hyperintense on T2WI (b) and T2FLAIR (c); the solid part of the tumor shows obvious heterogeneous enhancement on enhanced T1WI (d). The DWI (b = 1000 s mm–2) showed the solid part of the tumor as hyperintense (e); ADC value was 0.941 × 10⁻³ mm2 s–1 (f); the DWI [b = 1800 s mm–2 (g), b = 2500 s mm–2 (h), b = 3000 s mm–2 (i), b = 3500 s mm–2 (j), b = 4000 s mm–2 (k)] also showed the solid part of the tumor as hyperintense, the UHBV-ADC value was 0.160 × 10⁻³ mm2 s–1 (l). ADC, apparent diffusion coefficient; T1W1, T1 weighted image, T2W1, T2 weighted image; T2 FLAIR, T2 fluid-attenuated inversion recovery image; UHBV-ADC, ultrahigh-b-value-ADC.
Figure 4.
(a–d): Brain MRI of 42-year-old female with astrocytoma in the right temporal lobe The solid part of the tumor shows obvious heterogeneous enhancement on enhanced T1WI (a). ADC map shows hypointensity (blue), ADC value was 0.820 × 10⁻³ mm2 s–1 (b) , the UHBV-ADC map also showed hypointensity (blue), UHBV-ADC value was 0.100 × 10⁻³ mm2 s–1 (c), Histopathological findings (HE) were consistent with Grade II tumor (d); (e–h): Brain MRI of 42-year-old male with astrocytoma in the left temporal lobe. The solid part of the tumor also shows obvious heterogeneous enhancement on enhanced T1WI (e). ADC map showed hypointensity (blue), ADC value was 0.900 × 10⁻³ mm2 s–1 (f), while the UHBV-ADC map showed hyperintensity (yellow-green), UHBV-ADC value was 0.140 × 10⁻³ mm2 s–1 (g), Histopathological findings (HE) were consistent with Grade IV astrocytoma (h). ADC, apparent diffusion coefficient; T1WI, T1- weighted image, T2WI, T2 weighted image; T2 FLAIR, T2 fluid-attenuated inversion recovery image; UHBV-ADC, ultra-high-b-value-ADC.
Table 2.
DWI and UHBV-DWI parameters in patients with low- and high-grade astrocytomas
| Parameter | Tumoral solid part | Peritumoral edematous part | ||||
| Low-grade (N = 15) | High-grade (N = 25) | p | Low-grade (N = 11) | High-grade (N = 23) | p | |
| ADC (×10−3 mm2 s–1) | 1.04 ± 0.09 | 0.97 ± 0.08 | 0.020a | 0.20 ± 0.02 | 0.19 ± 0.06 | 0.800 |
| UHBV-ADC (×10−3 mm2 s–1) | 0.12 ± 0.02 | 0.14 ± 0.01 | 0.001a | 0.17 ± 0.02 | 0.18 ± 0.02 | 0.152 |
indicates statistical significance.
ROC analysis of UHBV-DWI and DWI parameters in the solid part of the tumor
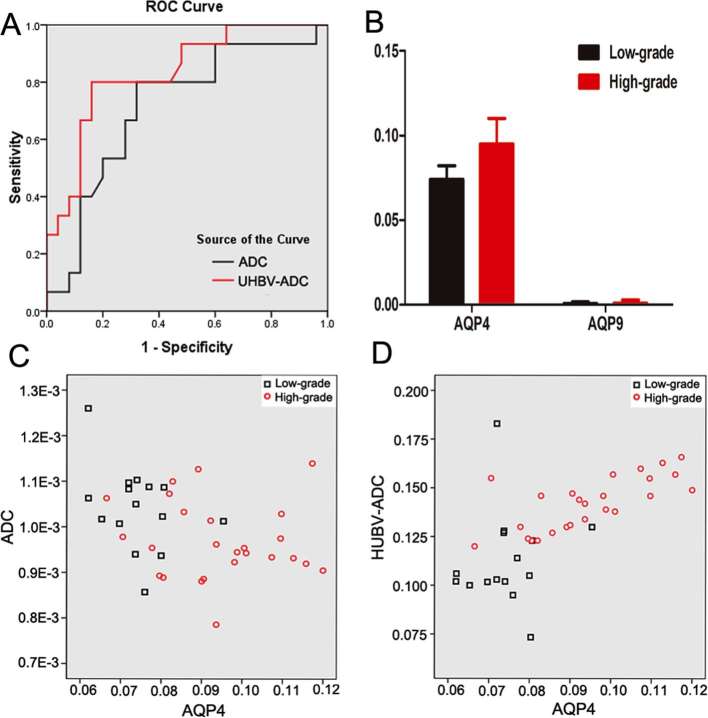
ROC analysis results of UHBV-ADC and ADC values in the solid parts of the tumor are shown in Figure 5a. The optimal threshold, specificity and sensitivity of each parameter are shown in Table 3. UHBV-ADC (0.810) value generated by five multi-UHBVs (1800–4000 s mm–2) had larger area under the curve (AUC) than that of ADC value (0.713). The AUC of UHBV-ADC was significantly higher than that of ADC (p = 0.041).
Figure 5.
ROC curve analysis of DWI and UHBV-DWI parameters in the solid parts of the astrocytoma (a). The level of AQP4, AQP9 mRNA in the solid parts of the astrocytoma (b); results of Spearman correlation analysis demonstrating the correlation between AQP4 expression and each parameter in the solid parts of astrocytomas (c, d). AQP, aquaporin; DWI, diffusion-weighted image; ROC, receiver operating characteristic UHBV-DWI, ultra-high-b-value-DWI.
Table 3.
ROC analysis of DWI and UHBV-DWI parameters in patients with low- and high-grade astrocytomas
| Parameter | Cut-off value | Sensitivity | Specificity | AUC | p |
| ADC | 0.869 | 93.3% | 96.0% | 0.713 | 0.025a |
| UHBV-ADC | 0.098 | 100.0% | 85.0% | 0.810 | 0.002a |
indicates statistical significance.
AQP mRNA analysis in the solid parts of the tumor
The levels of AQP1, AQP4 and AQP9 mRNA in the solid parts of the tumors are shown in Figure 6 and Table 4. AQP4 mRNA was obviously higher in HGAs as compared to that in LGAs (Figure 5b). There was little AQP9 mRNA in the solid parts of the tumors, and with no significant difference between LGAs and HGAs groups. No AQP1 mRNA expression was observed in the solid parts of the tumors.
Figure 6.
Real-time PCR study of the solid parts of astrocytomas. The amplification and melt curves of AQP1 mRNA (a), AQP4 mRNA (b), AQP9 mRNA (c), β-actin mRNA (d). It showed that there was much AQP4 mRNA, a little AQP9 mRNA and no AQP1 mRNA expression in the solid parts of the tumors. AQP, aquaporin; PCR, polymerase chain reaction.
Table 4.
Expression of AQP1, AQP4 and AQP9 in patients with low- and high-grade astrocytomas
| Parameter (IU ml–1) | Tumoral solid part | ||
| Low-grade (N = 15) | High-grade (N = 25) | p | |
| AQP4 | 0.074 ± 0.008 | 0.095 ± 0.015 | 0.000* |
| AQP9 | 0.699 ± 0.01 (×10−3) | 1.04 ± 0.02 (×10−3) | 0.753 |
| AQP1 | – | – | – |
AQP, aquaporin. * indicates statistical significance.
“–” indicates nil mRNA expression on PCR.
Correlation between AQP4 mRNA and diffusion parameters
Results of Spearman correlation analysis between AQP4 mRNA levels and each parameter (UHBV-ADC and ADC) in the solid parts of the tumors are shown in Figure 5c–d. UHBV-ADC value showed a positive correlation with AQP4 expression (r = 0.646; p < 0.01), while ADC value showed a negative correlation with AQP4 expression (r = −0.357; p = 0.024).
Discussion
In this study, UHBV-ADC values generated by five multi UHBVs (1800–4000 s mm–2) in the solid parts of the tumors were significantly higher in the HGAs group as compared to that in the LGAs group. On ROC analysis, UHBV-ADC (0.810) had a much higher AUC as compared to that of ADC (0.713), which suggests that UHBV-DWI allowed for a more accurate grading of cerebral astrocytomas than DWI. These findings may be explained by two reasons. First, ADC values calculated by using a monoexponential model may not accurately reflect water molecular diffusion in vivo, as it is liable to be influenced by microvascular perfusion.10 While UHBV-ADC values generated by five UHBVs (1800–4000 s mm–2), which eliminates the influence of microvascular perfusion, the signal intensity mainly results from the component of slow diffusion.7 Secondly, theoretically, a higher b-value DWI provides better contrast with its reflection of more tissue diffusivity and less T2 shine-through effect.11, 12
Intravoxel incoherent motion imaging is based on a bicomponent model which including the fast diffusion component (blood perfusion) and the slow diffusion component (true water diffusion).13, 14 However, the exchange effects between the slow and fast diffusion components and membrane permeability are not considered in this model.15 Ling HY showed that UHBV-ADC generated by multi UHBVs (2000–5000 s mm–2) may provide a useful measure of brain damage in Parkinson's disease patients, and that UHBV-ADC may be associated with water transportation by AQP,7 which represented the exchange effects between the fast and slow diffusion components.
The AQPs are a family of water-channel proteins, which are plasma membrane water-transporting proteins. At least 13 AQP have now been discovered and they are widely expressed in various fluid-transporting epithelial and endothelial cells in mammals.8 Three AQPs have been clearly identified in the brain: AQP1, AQP4 and AQP9.16–18 In our study, AQP4 mRNA expression in the solid parts of HGAs was obviously higher than that in the corresponding parts of LGAs, which is consistent with literature; however, there was a little AQP9 mRNA, and no AQP1 mRNA in the solid parts of astrocytomas, which is not consistent with literature. AQP4 is the most important member of the AQP family in the central nervous system, which play a key role in the maintenance of the water and ion homeostasis.8, 19 Many studies have reported significantly greater expression of AQP4 in HGAs than that in LGAs or normal brain tissue. This suggests the involvement of AQP4 in inducing tumorigenic changes, particularly those affecting cell migration and cytoskeleton organization.20, 21
Further, our study showed that ADC value (r = −0.357; p = 0.024) had a little negative correlation with AQP4 expression, which is consistent with literature reported elsewhere.22, 23 But in our research, UHBV-ADC generated by five multi UHBVs (2000–5000 s mm–2) showed a positive correlation with AQP4 expression (r = 0.646; p < 0.01). The exact reason for this difference is not known. We think UHBV-ADC may be associated with AQP4,7 which may represent the exchange effects between the fast and slow diffusion pools. AQP4 is known to facilitate water transport into and out of the brain in central nerves system disorders.22 Recent studies have also shown AQP4 redistributed on the entire surface of the cells in HGAs, but not in LGAs.16, 23 The redistribution of AQP4 was thought to be a reaction to the vasogenic edema, which was caused by the breakdown of blood brain barrier, which facilitates the reabsorption of excess fluid.16, 23 Therefore, the change of AQP4 may be one of the reasons for the increase of UHBV-ADC value in HGAs, which needs further study.
Our study has several limitations. The relatively small sample size in our study is a key limitation of our study, as is the retrospective case selection. These are preliminary findings which need to be validated in future studies with a larger sample of patients with astrocyomas. Further, peritumoral edematous tissue was not obtained and biopsied for histological examination after surgery. Finally, higher b-values may decrease the signal-to-noise ratio, but the image of higher b-values is enough to reflect the feature of the astrocytomas, and image equality may be improved with the development of technology in the future.
Conclusion
UHBV-DWI allowed for a more accurate grading of cerebral astrocytoma than DWI, and UHBV-ADC value may be related with the AQP4 mRNA levels. UHBV-DWI could be of particular value in the assessment of astrocytoma.
Footnotes
Ethics: We declare that all human studies have been approved by the ethics committee of First Clinical Medical College of Shanxi Medical University.
Informed consent: The written informed consent was waived.
Contributor Information
Yan Tan, Email: tanyan123456@sina.com.
Hui Zhang, Email: zhanghui_mr@163.com.
Xiao-chun Wang, Email: 2010xiaochun@163.com.
Jiang-bo Qin, Email: qjb5400@163.com.
Le Wang, Email: sywar007@163.com.
REFERENCES
- 1.Ignjatović J, Stojanov D, Zivković V, Ljubisavljević S, Stojanović N, Stefanović I, et al. . Apparent diffusion coefficient in the evaluation of cerebral gliomas malignancy. Vojnosanit Pregl 2015; 72: 870–5. doi: 10.2298/VSP140229073I [DOI] [PubMed] [Google Scholar]
- 2.Yamasaki F, Kurisu K, Satoh K, Arita K, Sugiyama K, Ohtaki M, et al. . Apparent diffusion coefficient of human brain tumors at MR imaging. Radiology 2005; 235: 985–91. doi: 10.1148/radiol.2353031338 [DOI] [PubMed] [Google Scholar]
- 3.Kono K, Inoue Y, Nakayama K, Shakudo M, Morino M, Ohata K, et al. . The role of diffusion-weighted imaging in patients with brain tumors. AJNR Am J Neuroradiol 2001; 22: 1081–8. [PMC free article] [PubMed] [Google Scholar]
- 4.Cuccarini V, Erbetta A, Farinotti M, Cuppini L, Ghielmetti F, Pollo B, et al. . Advanced MRI may complement histological diagnosis of lower grade gliomas and help in predicting survival. J Neurooncol 2016; 126: 279–88. doi: 10.1007/s11060-015-1960-5 [DOI] [PubMed] [Google Scholar]
- 5.Seo HS, Chang KH, Na DG, Kwon BJ, Lee DH. High b-value diffusion (b = 3000 s/mm2) MR imaging in cerebral gliomas at 3T: visual and quantitative comparisons with b = 1000 s/mm2. AJNR Am J Neuroradiol 2008; 29: 458–63. doi: 10.3174/ajnr.A0842 [DOI] [PMC free article] [PubMed] [Google Scholar]
- 6.Yamasaki F, Kurisu K, Aoki T, Yamanaka M, Kajiwara Y, Watanabe Y, et al. . Advantages of high b-value diffusion-weighted imaging to diagnose pseudo-responses in patients with recurrent glioma after bevacizumab treatment. Eur J Radiol 2012; 81: 2805–10. doi: 10.1016/j.ejrad.2011.10.018 [DOI] [PubMed] [Google Scholar]
- 7.Xueying L, Zhongping Z, Zhoushe Z, Li G, Yongjin T, Changzheng S, et al. . Investigation of apparent diffusion coefficient from ultra-high b-values in Parkinson’s disease. Eur Radiol 2015; 25: 2593–600. doi: 10.1007/s00330-015-3678-3 [DOI] [PubMed] [Google Scholar]
- 8.Papadopoulos MC, Verkman AS. Aquaporin water channels in the nervous system. Nat Rev Neurosci 2013; 14: 265–77. doi: 10.1038/nrn3468 [DOI] [PMC free article] [PubMed] [Google Scholar]
- 9.Tan Y, Zhang H, Zhao RF, Wang XC, Qin JB, Wu XF, et al. . Comparison of the values of MRI diffusion kurtosis imaging and diffusion tensor imaging in cerebral astrocytoma grading and their association with aquaporin-4. Neurol India 2016; 64: 265–72. doi: 10.4103/0028-3886.177621 [DOI] [PubMed] [Google Scholar]
- 10.Romano A, Bozzao A, Bonamini M, Fasoli F, Ferrante M, Floris R, et al. . Diffusion-weighted MR Imaging: clinical applications in neuroradiology. Radiol Med 2003; 106: 521–48. [PubMed] [Google Scholar]
- 11.DeLano MC, Cooper TG, Siebert JE, Potchen MJ, Kuppusamy K. High-b-value diffusion-weighted MR imaging of adult brain: image contrast and apparent diffusion coefficient map features. AJNR Am J Neuroradiol 2000; 21: 1830–6. [PMC free article] [PubMed] [Google Scholar]
- 12.Burdette JH, Durden DD, Elster AD, Yen YF. High b-value diffusion-weighted MRI of normal brain. J Comput Assist Tomogr 2001; 25: 515–9. doi: 10.1097/00004728-200107000-00002 [DOI] [PubMed] [Google Scholar]
- 13.Federau C, Meuli R, O’Brien K, Maeder P, Hagmann P. Perfusion measurement in brain gliomas with intravoxel incoherent motion MRI. AJNR Am J Neuroradiol 2014; 35: 256–62. doi: 10.3174/ajnr.A3686 [DOI] [PMC free article] [PubMed] [Google Scholar]
- 14.Togao O, Hiwatashi A, Yamashita K, Kikuchi K, Mizoguchi M, Yoshimoto K, et al. . Differentiation of high-grade and low-grade diffuse gliomas by intravoxel incoherent motion MR imaging. Neuro Oncol 2016; 18: 132–41. doi: 10.1093/neuonc/nov147 [DOI] [PMC free article] [PubMed] [Google Scholar]
- 15.Le Bihan D. Apparent diffusion coefficient and beyond: what diffusion MR imaging can tell us about tissue structure. Radiology 2013; 268: 318–22. doi: 10.1148/radiol.13130420 [DOI] [PubMed] [Google Scholar]
- 16.Saadoun S, Papadopoulos MC, Davies DC, Bell BA, Krishna S. Increased aquaporin 1 water channel expression in human brain tumours. Br J Cancer 2002; 87: 621–3. doi: 10.1038/sj.bjc.6600512 [DOI] [PMC free article] [PubMed] [Google Scholar]
- 17.Ding T, Gu F, Fu L, Ma YJ. Aquaporin-4 in glioma invasion and an analysis of molecular mechanisms. J Clin Neurosci 2010; 17: 1359–61. doi: 10.1016/j.jocn.2010.02.014 [DOI] [PubMed] [Google Scholar]
- 18.Verkman AS, Anderson MO, Papadopoulos MC. Aquaporins: important but elusive drug targets. Nat Rev Drug Discov 2014; 13: 259–77. doi: 10.1038/nrd4226 [DOI] [PMC free article] [PubMed] [Google Scholar]
- 19.Schwab A, Stock C. Ion channels and transporters in tumour cell migration and invasion. Philos Trans R Soc Lond B Biol Sci 2014; 369: 20130102. doi: 10.1098/rstb.2013.0102 [DOI] [PMC free article] [PubMed] [Google Scholar]
- 20.Warth A, Mittelbronn M, Wolburg H. Redistribution of the water channel protein aquaporin-4 and the K+ channel protein Kir4.1 differs in low- and high-grade human brain tumors. Acta Neuropathol 2005; 109: 418–26. doi: 10.1007/s00401-005-0984-x [DOI] [PubMed] [Google Scholar]
- 21.Isokpehi RD, Wollenberg Valero KC, Graham BE, Pacurari M, Sims JN, Udensi UK, et al. . Secondary data analytics of aquaporin expression levels in glioblastoma stem-like cells. Cancer Inform 2015; 14: CIN.S22058. doi: 10.4137/CIN.S22058 [DOI] [PMC free article] [PubMed] [Google Scholar]
- 22.Kong L, Lian G, Zheng W, Liu H, Zhang H, Chen R. Effect of alcohol on diffuse axonal injury in rat brainstem: diffusion tensor imaging and aquaporin-4 expression study. Biomed Res Int 2013; 2013: 1–9. doi: 10.1155/2013/798261 [DOI] [PMC free article] [PubMed] [Google Scholar]
- 23.Yao X, Derugin N, Manley GT, Verkman AS. Reduced brain edema and infarct volume in aquaporin-4 deficient mice after transient focal cerebral ischemia. Neurosci Lett 2015; 584: 368–72. doi: 10.1016/j.neulet.2014.10.040 [DOI] [PMC free article] [PubMed] [Google Scholar]


